
Key takeaways
- ETH is up nearly 2% in the last 24 hours and now trades above $3,600.
- Technical indicators are showing signs of weakness, suggesting a bearish trend for the coin.
ETH stays above $3,600 as BTC dips
The cryptocurrency market has been volatile over the last couple of hours, with Bitcoin dropping below the $116k level. Bitcoin lost nearly 2% of its value and now risks dropping below $115k if the selloff continues.
However, Ether, the second-largest cryptocurrency by market cap, is currently in the green after adding more than 1% to its value in the last 24 hours. This allowed it to top the $3,600 mark.
However, the technical indicators are suggesting signs of weakness, and ETH could experience a selloff. The higher timeframe chart remains bullish, indicating that the buyers are still in control.
ETH could retest $3k if the bearish trend persists
The ETH/USD 4-hour chart remains bullish as Ether outperforms Bitcoin and some other leading cryptocurrencies. The price is also efficient, suggesting that ETH could be getting ready for another upward movement.
However, the technical indicators on the lower timeframe are switching bearish, suggesting a selloff on the horizon. ETH failed to find support around the daily level of $3.730 and declined below $3,600.
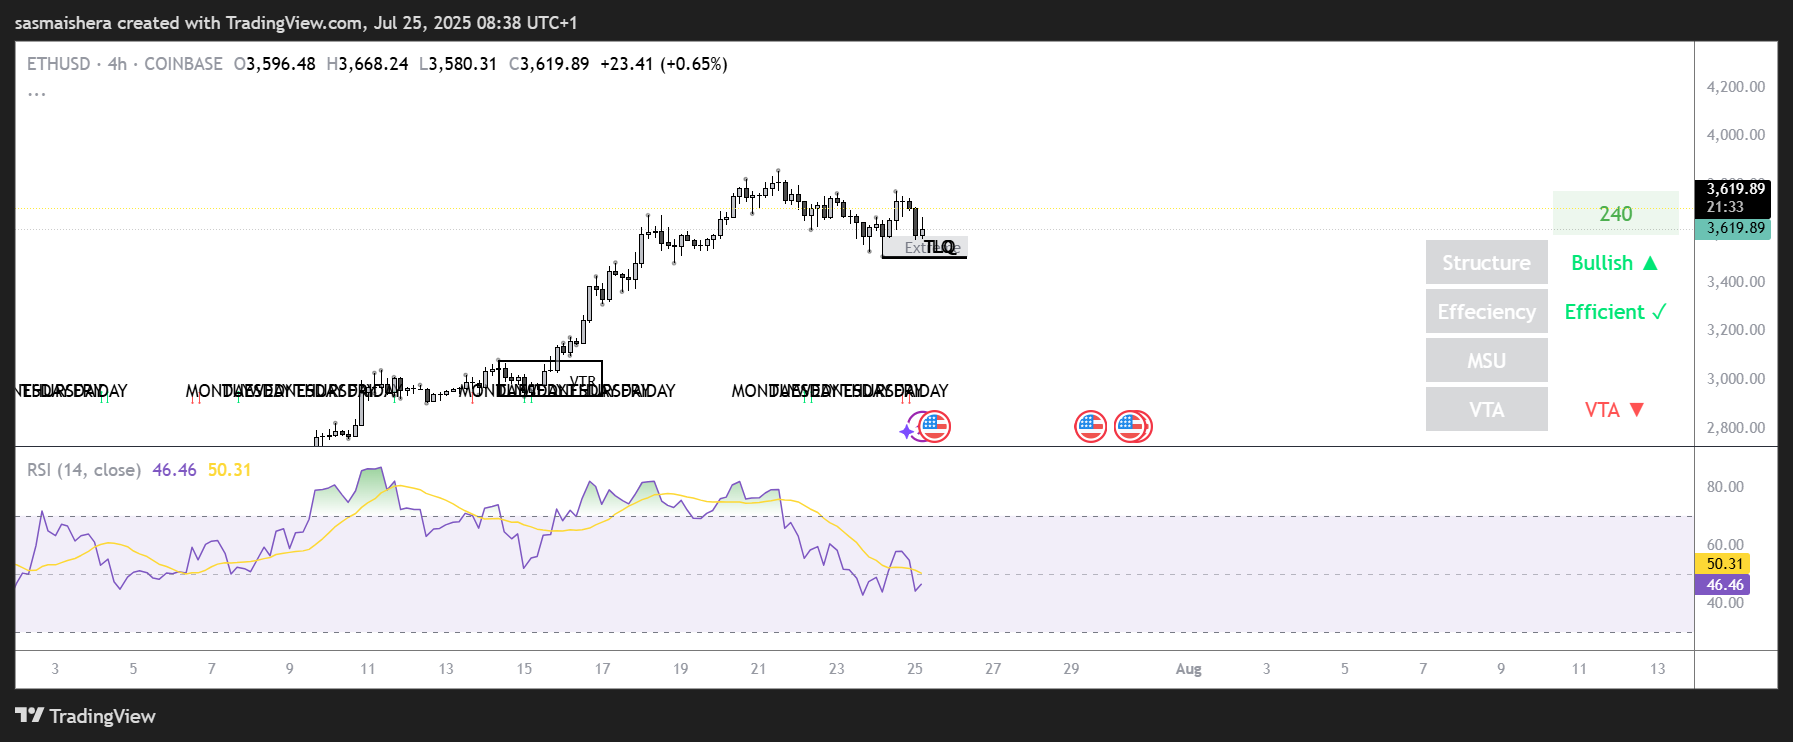
However, it has recovered its position above $3,600. If Ether closes below the $3,500 daily candle, it could experience a correction to retest the $3,000 psychological level.
The Relative Strength Index of 49 shows that the bulls are losing control of the market, indicating a fading bullish momentum.
Furthermore, ETH’s MACD indicator is converging closer together, and the green histogram bars are also falling, both suggesting a growing bearish appetite.
On the flipside, if ETH’s daily candle closes above $3,500, the bulls could push the price higher in the near term. ETH could retest the $3,730 resistance level in the coming hours or days before aiming for the $4k psychological level.