Bitcoin's Bollinger Bands Tightest Since February; XRP, SOL Establish Lower Highs
This is a daily analysis of top tokens with CME futures by CoinDesk analyst and Chartered Market Technician Omkar Godbole.
Bitcoin: Bollinger bands tighten
BTC's continued consolidation between $116,000 and $120,000 calls for renewed focus on Bollinger bands, which have now tightened to levels last seen before the late February volatility explosion that saw prices drop from $95,000 to $80,000 within days.
Tighter bands indicate that the market is coiling up and building energy for a big move in either direction. Bollinger bands are volatility bands placed two standard deviations above and below the asset's 20-day simple moving average.
This view is consistent with the VIX's bullish August seasonality that suggests heightened price turbulence for stocks and bitcoin over the coming four weeks.
A break below $116,000 would imply downside volatility explosion, exposing the former resistance-turned-support at $111,965. Conversely, a quick move to new lifetime highs appears likely if tighter Bollinger bands resolve bullishly.
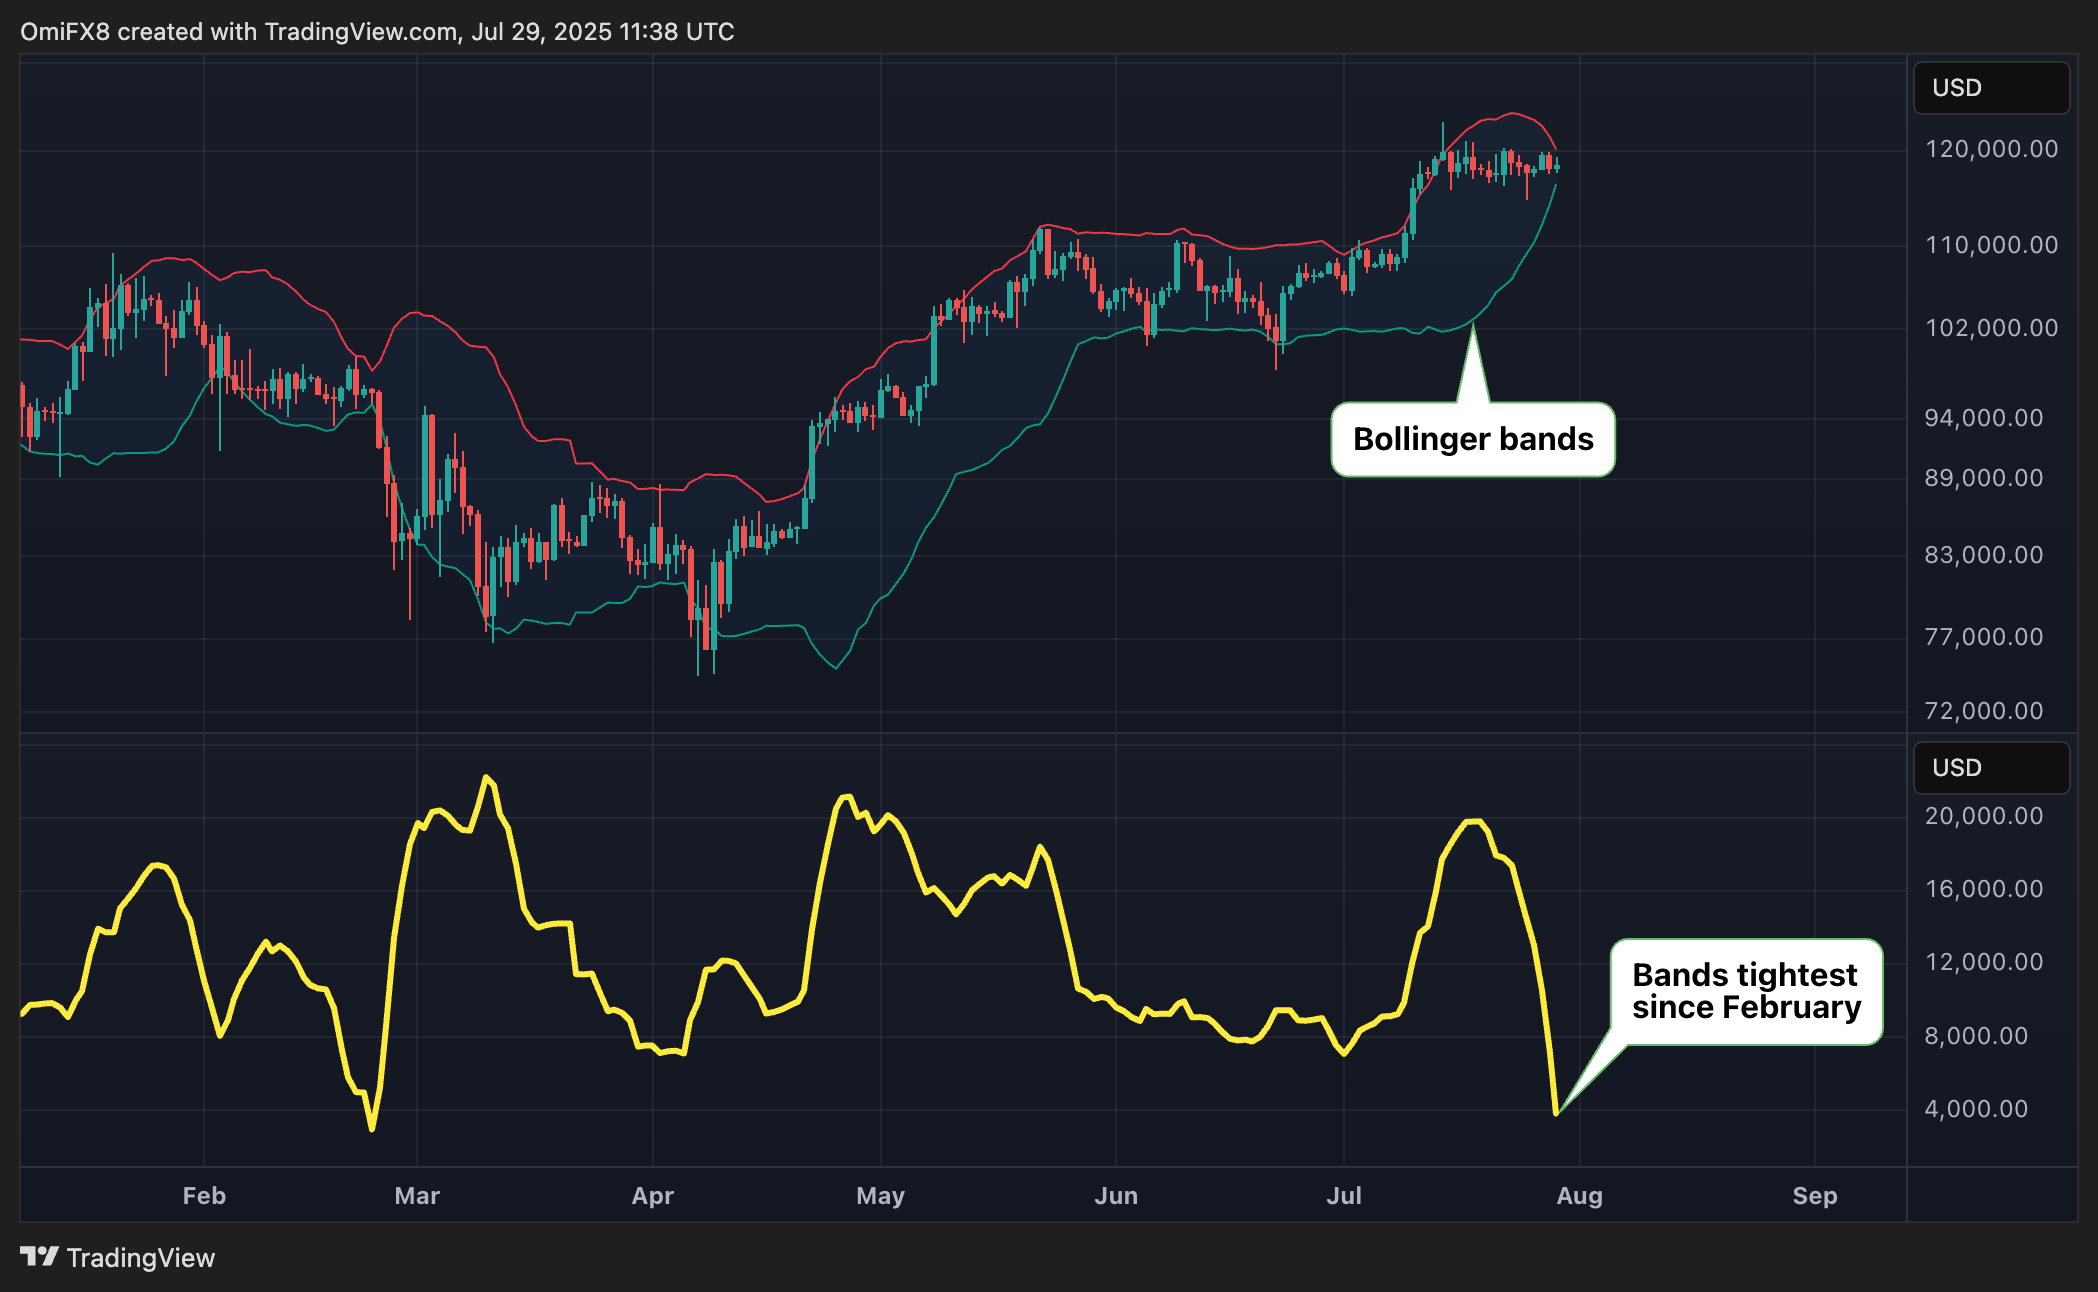
- AI's take: Thesignificant contraction of volatility, especially after a strong uptrend, often signals that the price is coiling up for a large and potentially explosive move in the near future.
- Resistance: $120,000, $123,181.
- Support: $116,000-$117,000, $114,700, $111,965.
XRP: Lower high established
XRP fell 3.59% on Monday, creating a red candle with a prominent upper wick, suggesting seller dominance. The cryptocurrency printed a lower high at $3.33, the first since peaking at $3.65 with a bearish tweezer top pattern, indicating a potential deeper pullback ahead. This suggests that it's only a matter of time before the mini-ascending channel seen on the hourly chart gives way, exposing the recent low of $2.95 and possibly the May high of $2.65. The hurdle at $3.35 must be overcome to negate the bearish bias.
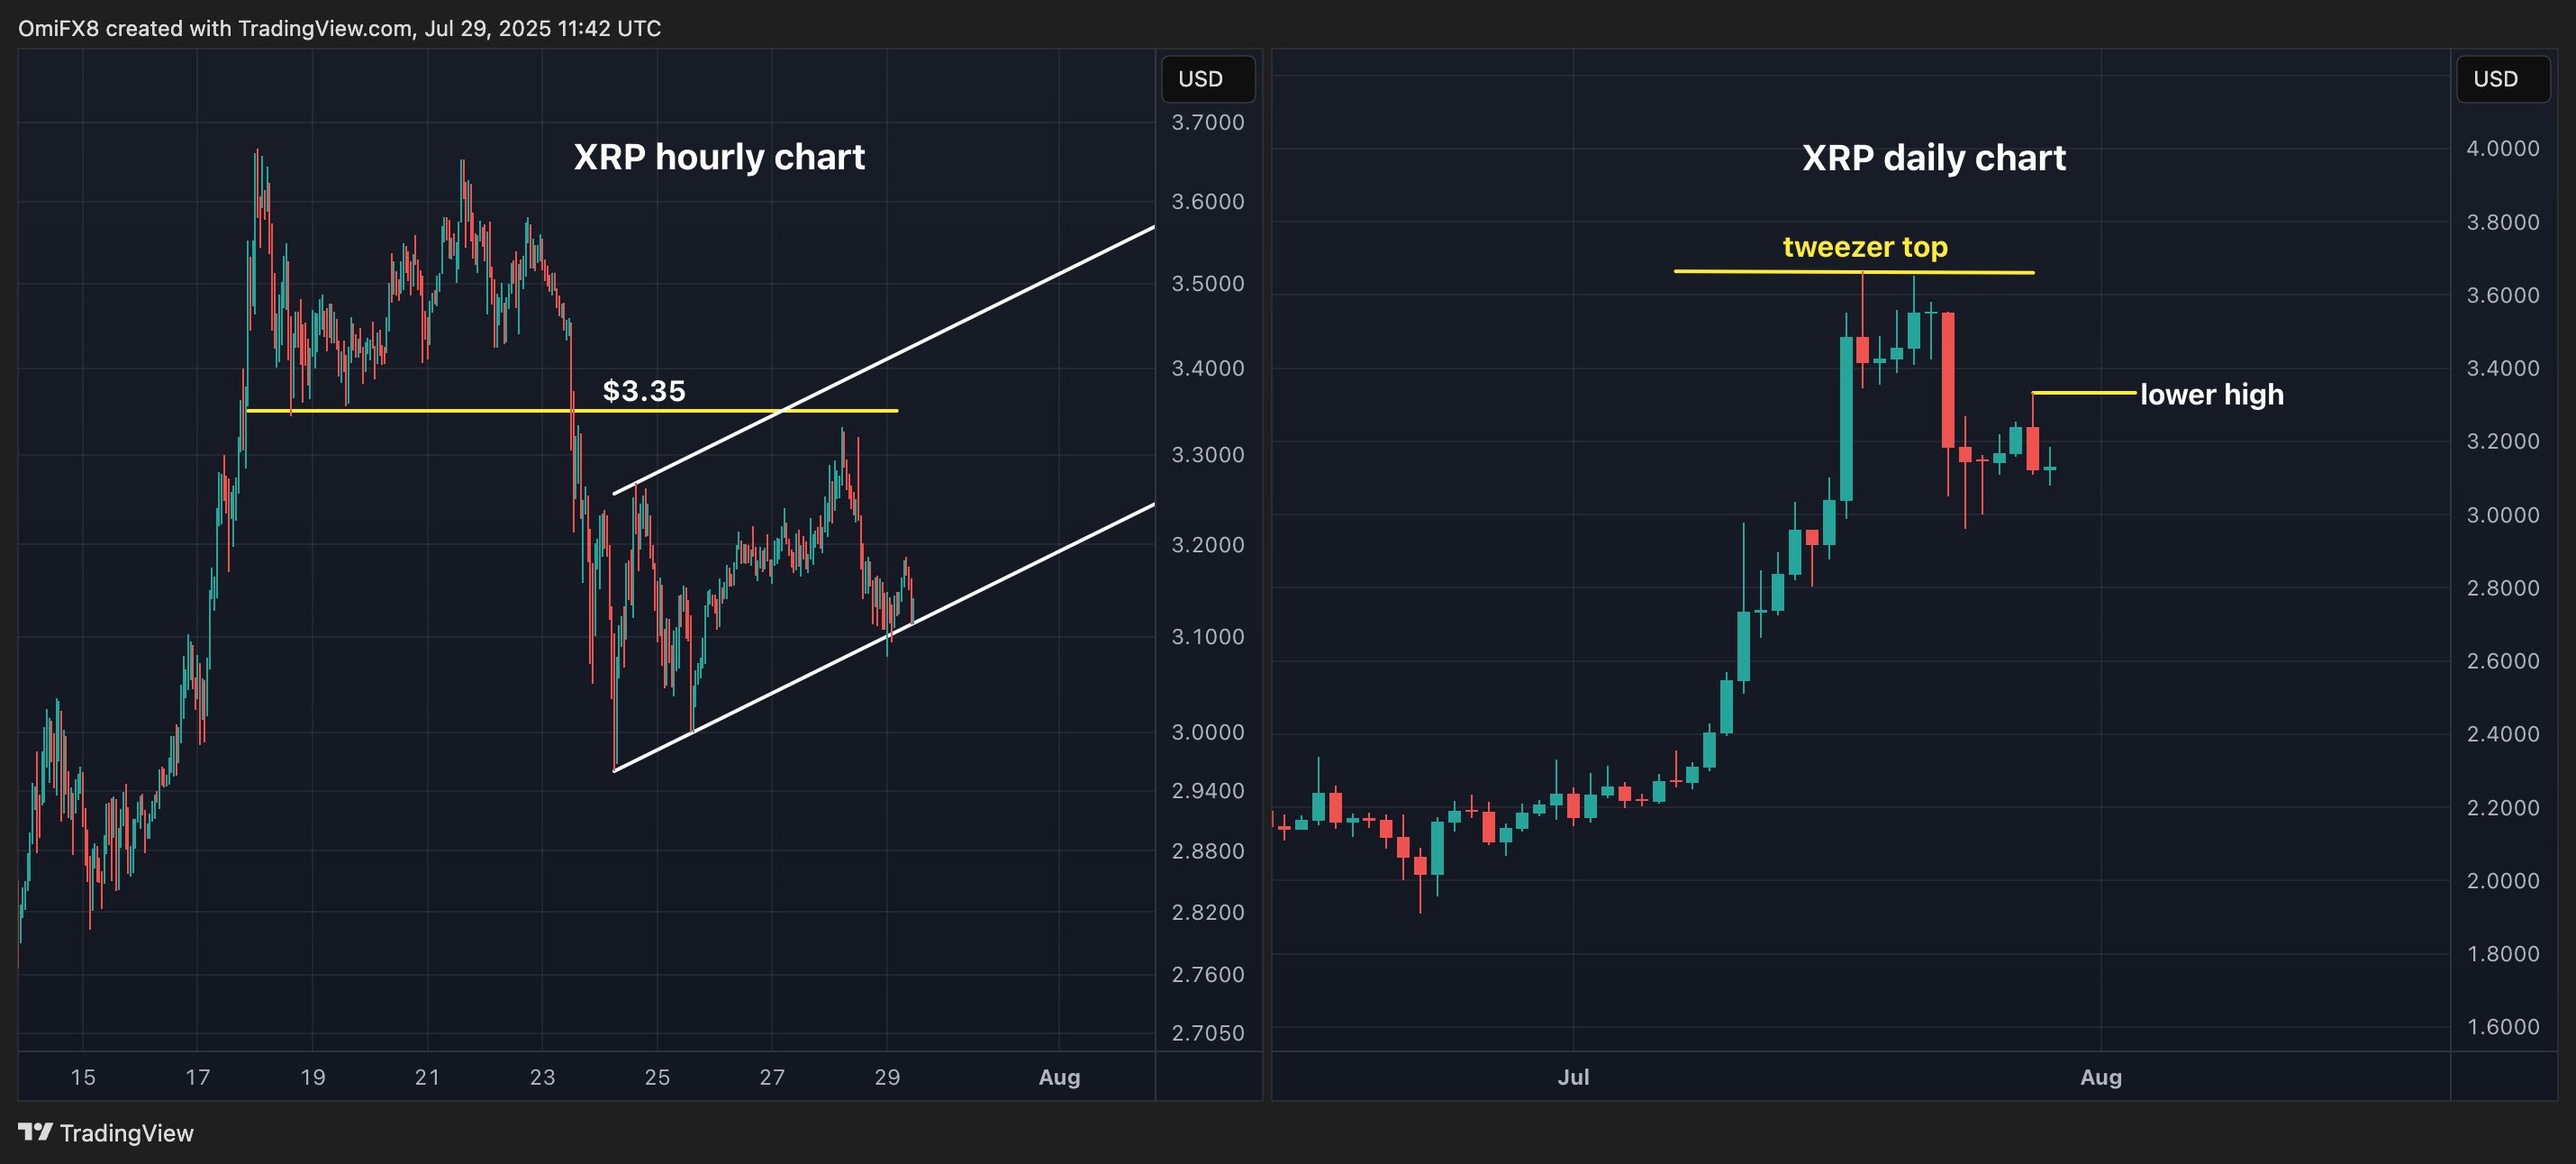
- AI's take: Traders should primarily focus on whether XRP can decisively reclaim and hold above the crucial $3.35 level, which now acts as immediate resistance. A failure to do so would reinforce the daily chart's bearish reversal signals (tweezer top, lower high), suggesting further downside,
- Resistance: $3.35, $3.65, $4.00.
- Support: $2.95, $2.65, $2.44 (the 200-day SMA).
Ether: RSI diverging bearishly
Ether's 14-day relative strength index (RSI) has diverged bearishly from the price, with the MACD histogram nearing a negative crossover confirmation. These developments suggest a potential pullback to the higher low of $3,510 registered on July 24. A violation there could extend the pullback toward $3,000.
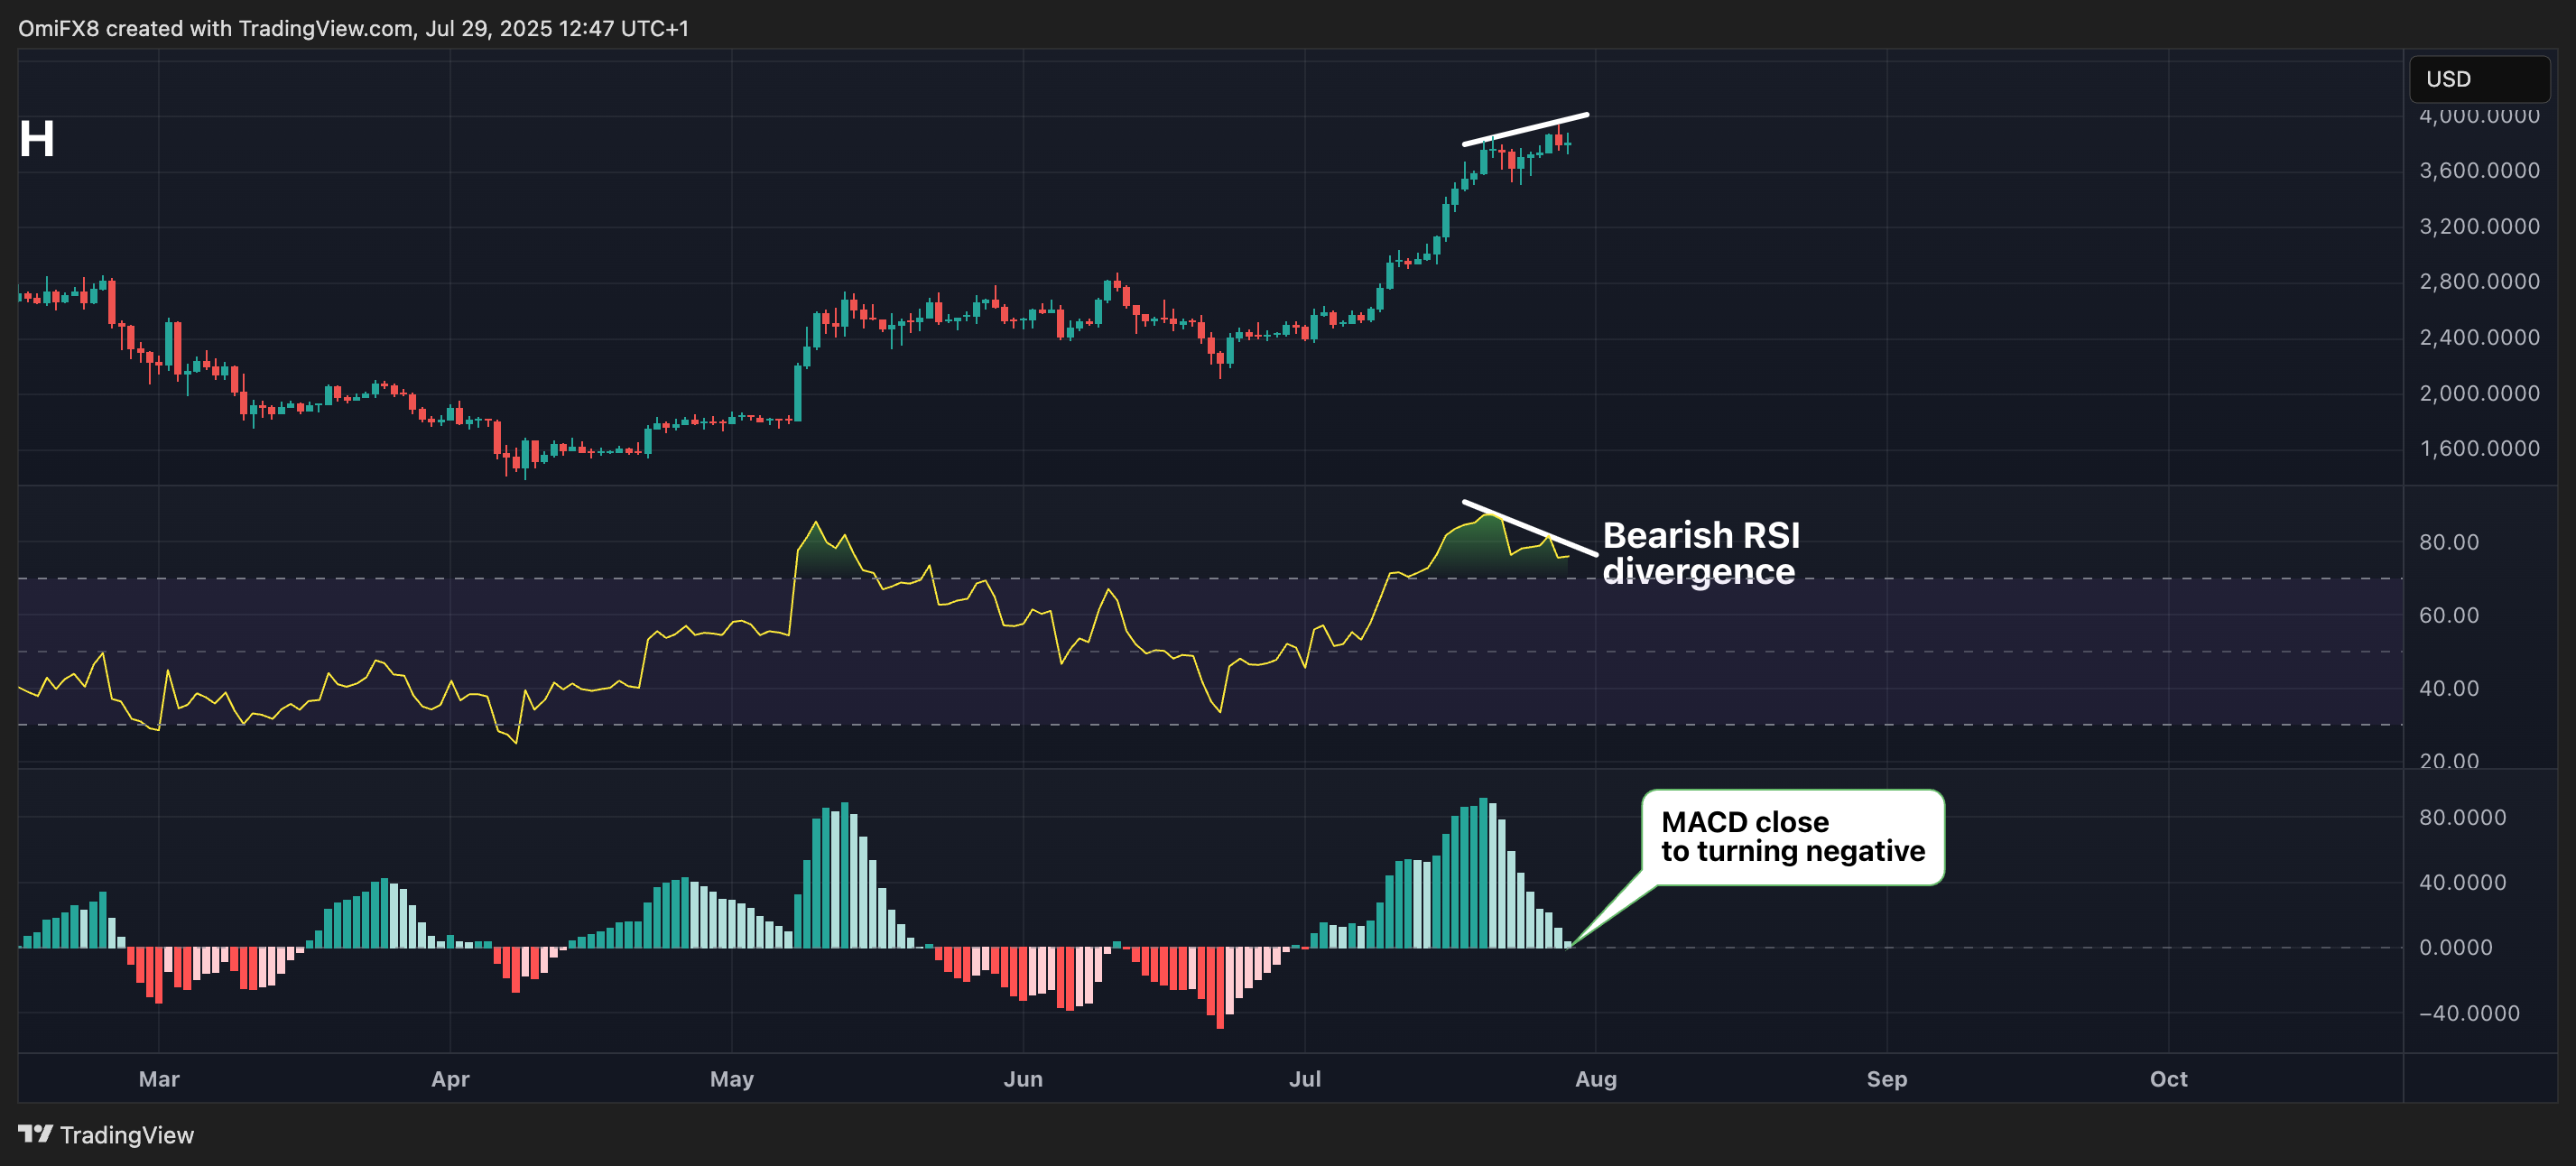
- AI's take: Traders should primarily focus on the bearish divergence displayed by the RSI, which signals weakening momentum despite Ether's recent price high.
- Resistance: $4,000, $4100, $4,382.
- Support: $3,731 (daily low), $3,510, $3,000.
Solana: XRP-like structure
SOL established a lower high at $195, reinforcing the bearish tweezer top pattern at $205-$206. Additionally, the cryptocurrency has dived out of a mini-ascending channel and the Ichimoku cloud on the hourly chart, suggesting the path of least resistance is to the downside. The resistance at $195 needs to be topped to invalidate the bearish bias.
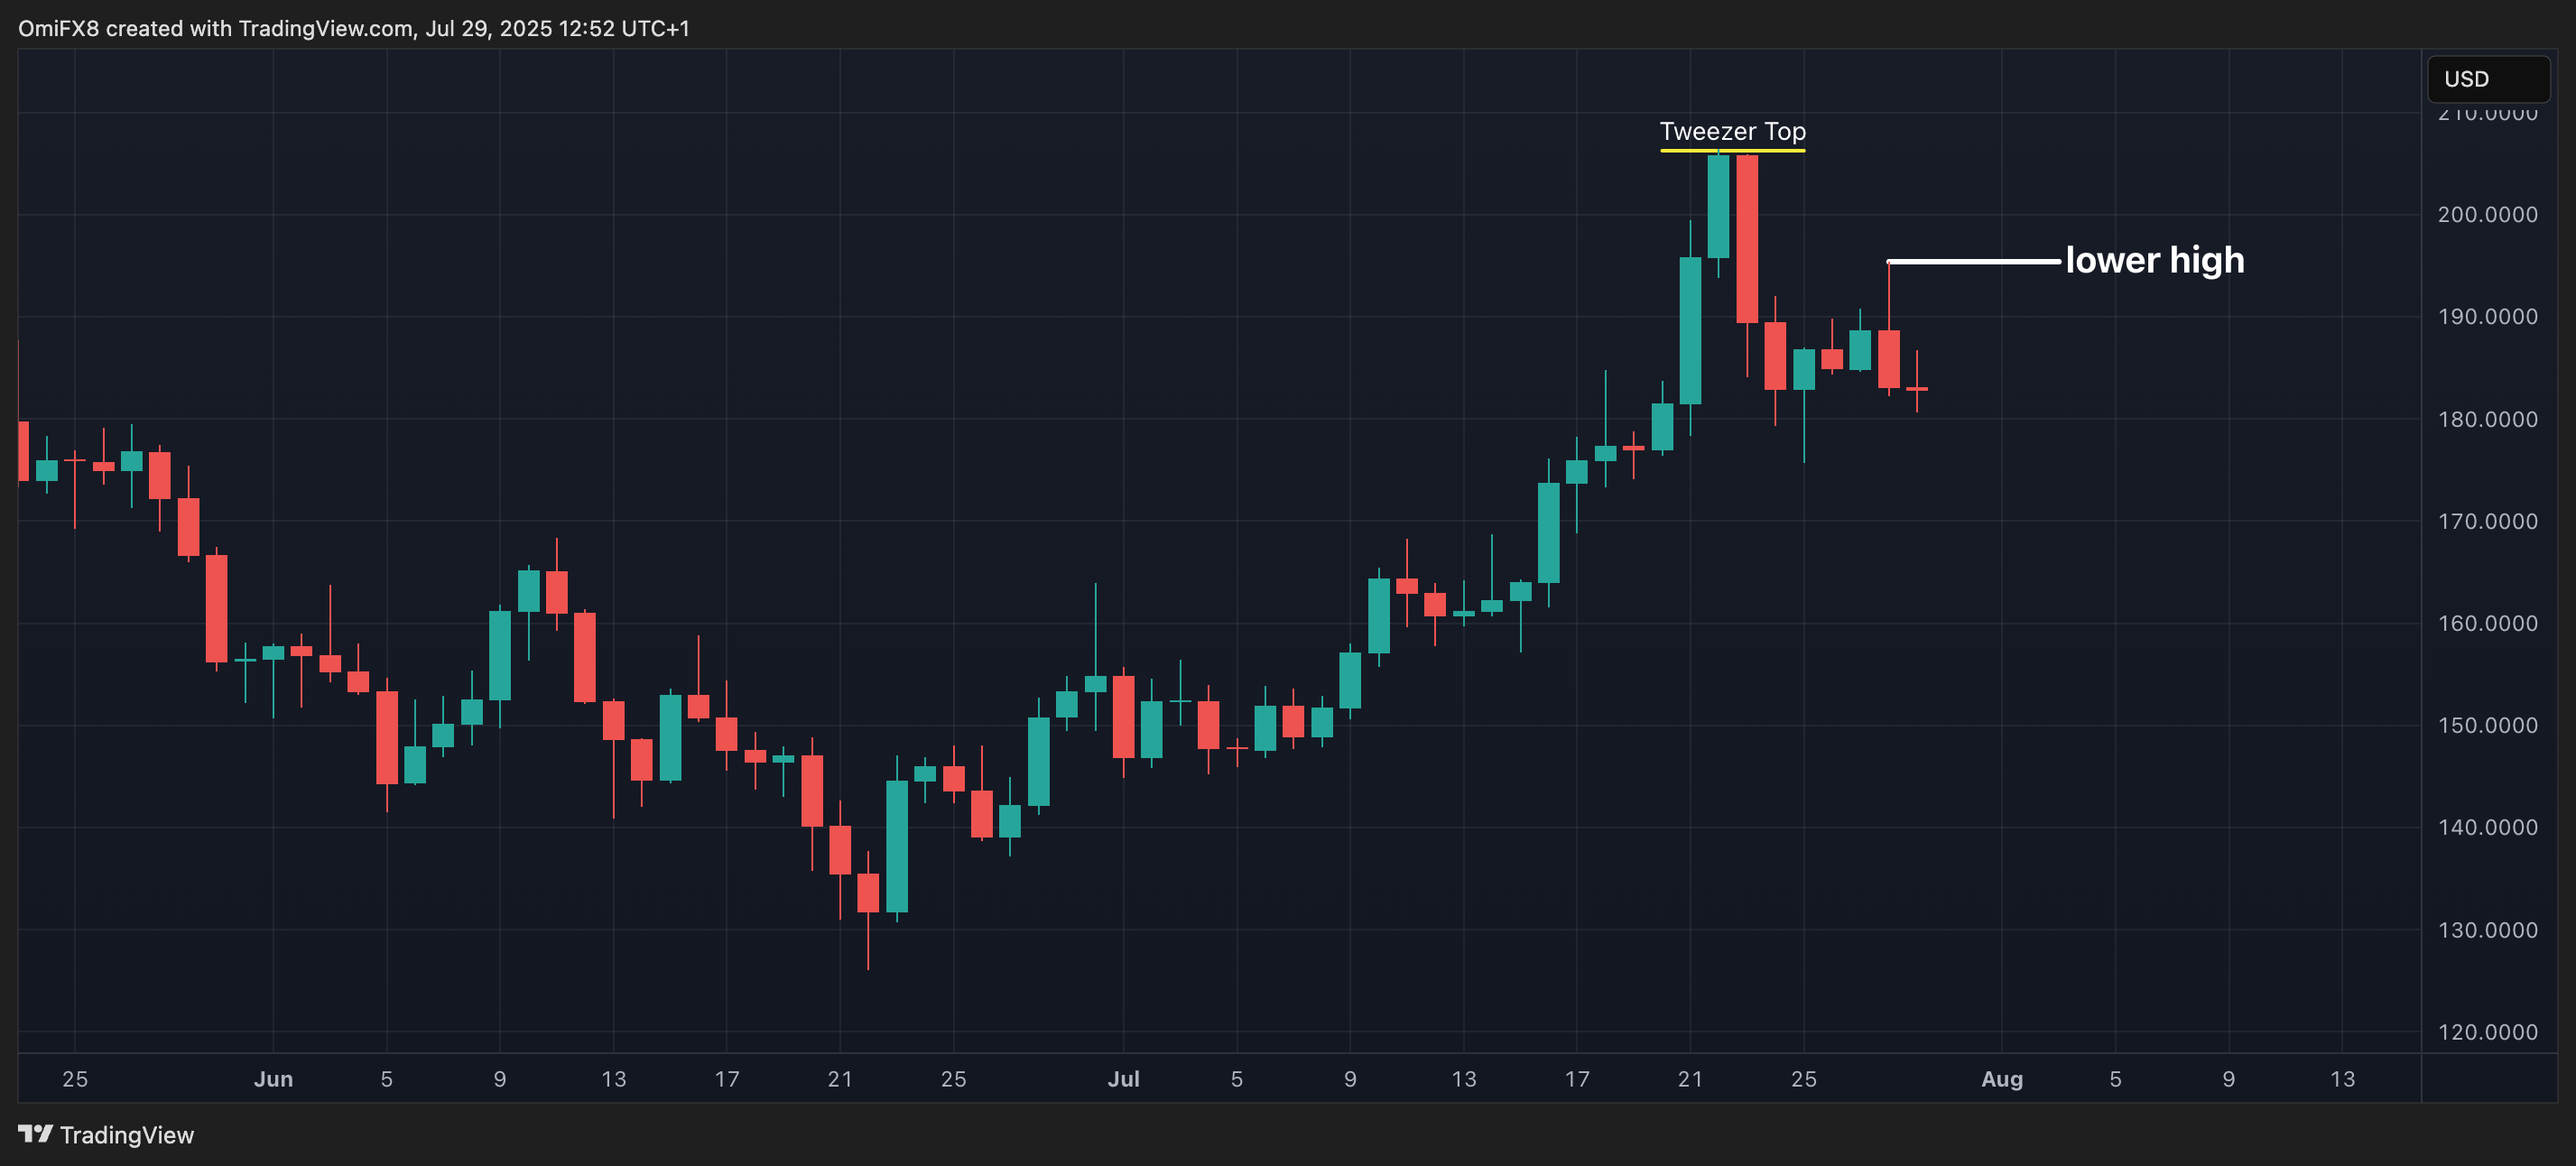
- AI's take: "Tweezer Top" candlestick pattern at the peak of the rally, immediately followed by the formation of a "lower high" is a powerful bearish reversal pattern, indicating that the strong upward momentum from July has likely ended
- Resistance: $195, $205-$206, $218.
- Support: $184, $163, $126.