Bitcoin’s $150,000 Dream Hinges on One Bullish Pattern: Breakout or Breakdown?
Bitcoin price has corrected by around 2.4% in the last 24 hours, holding just above $115,000. While traders remain cautious, one bullish pattern could decide whether Bitcoin makes a big push toward $150,000 or risks losing its upward momentum.
Let’s break down the key signals shaping this pivotal moment.
Fund Flow Ratio Points to Lower Selling Pressure
The Fund Flow Ratio measures how many coins are being moved to and from exchanges compared to total on-chain transfers. A higher ratio usually means increased exchange activity, often linked to selling. A drop in the ratio means fewer coins are heading toward exchanges, signaling reduced immediate sell pressure.
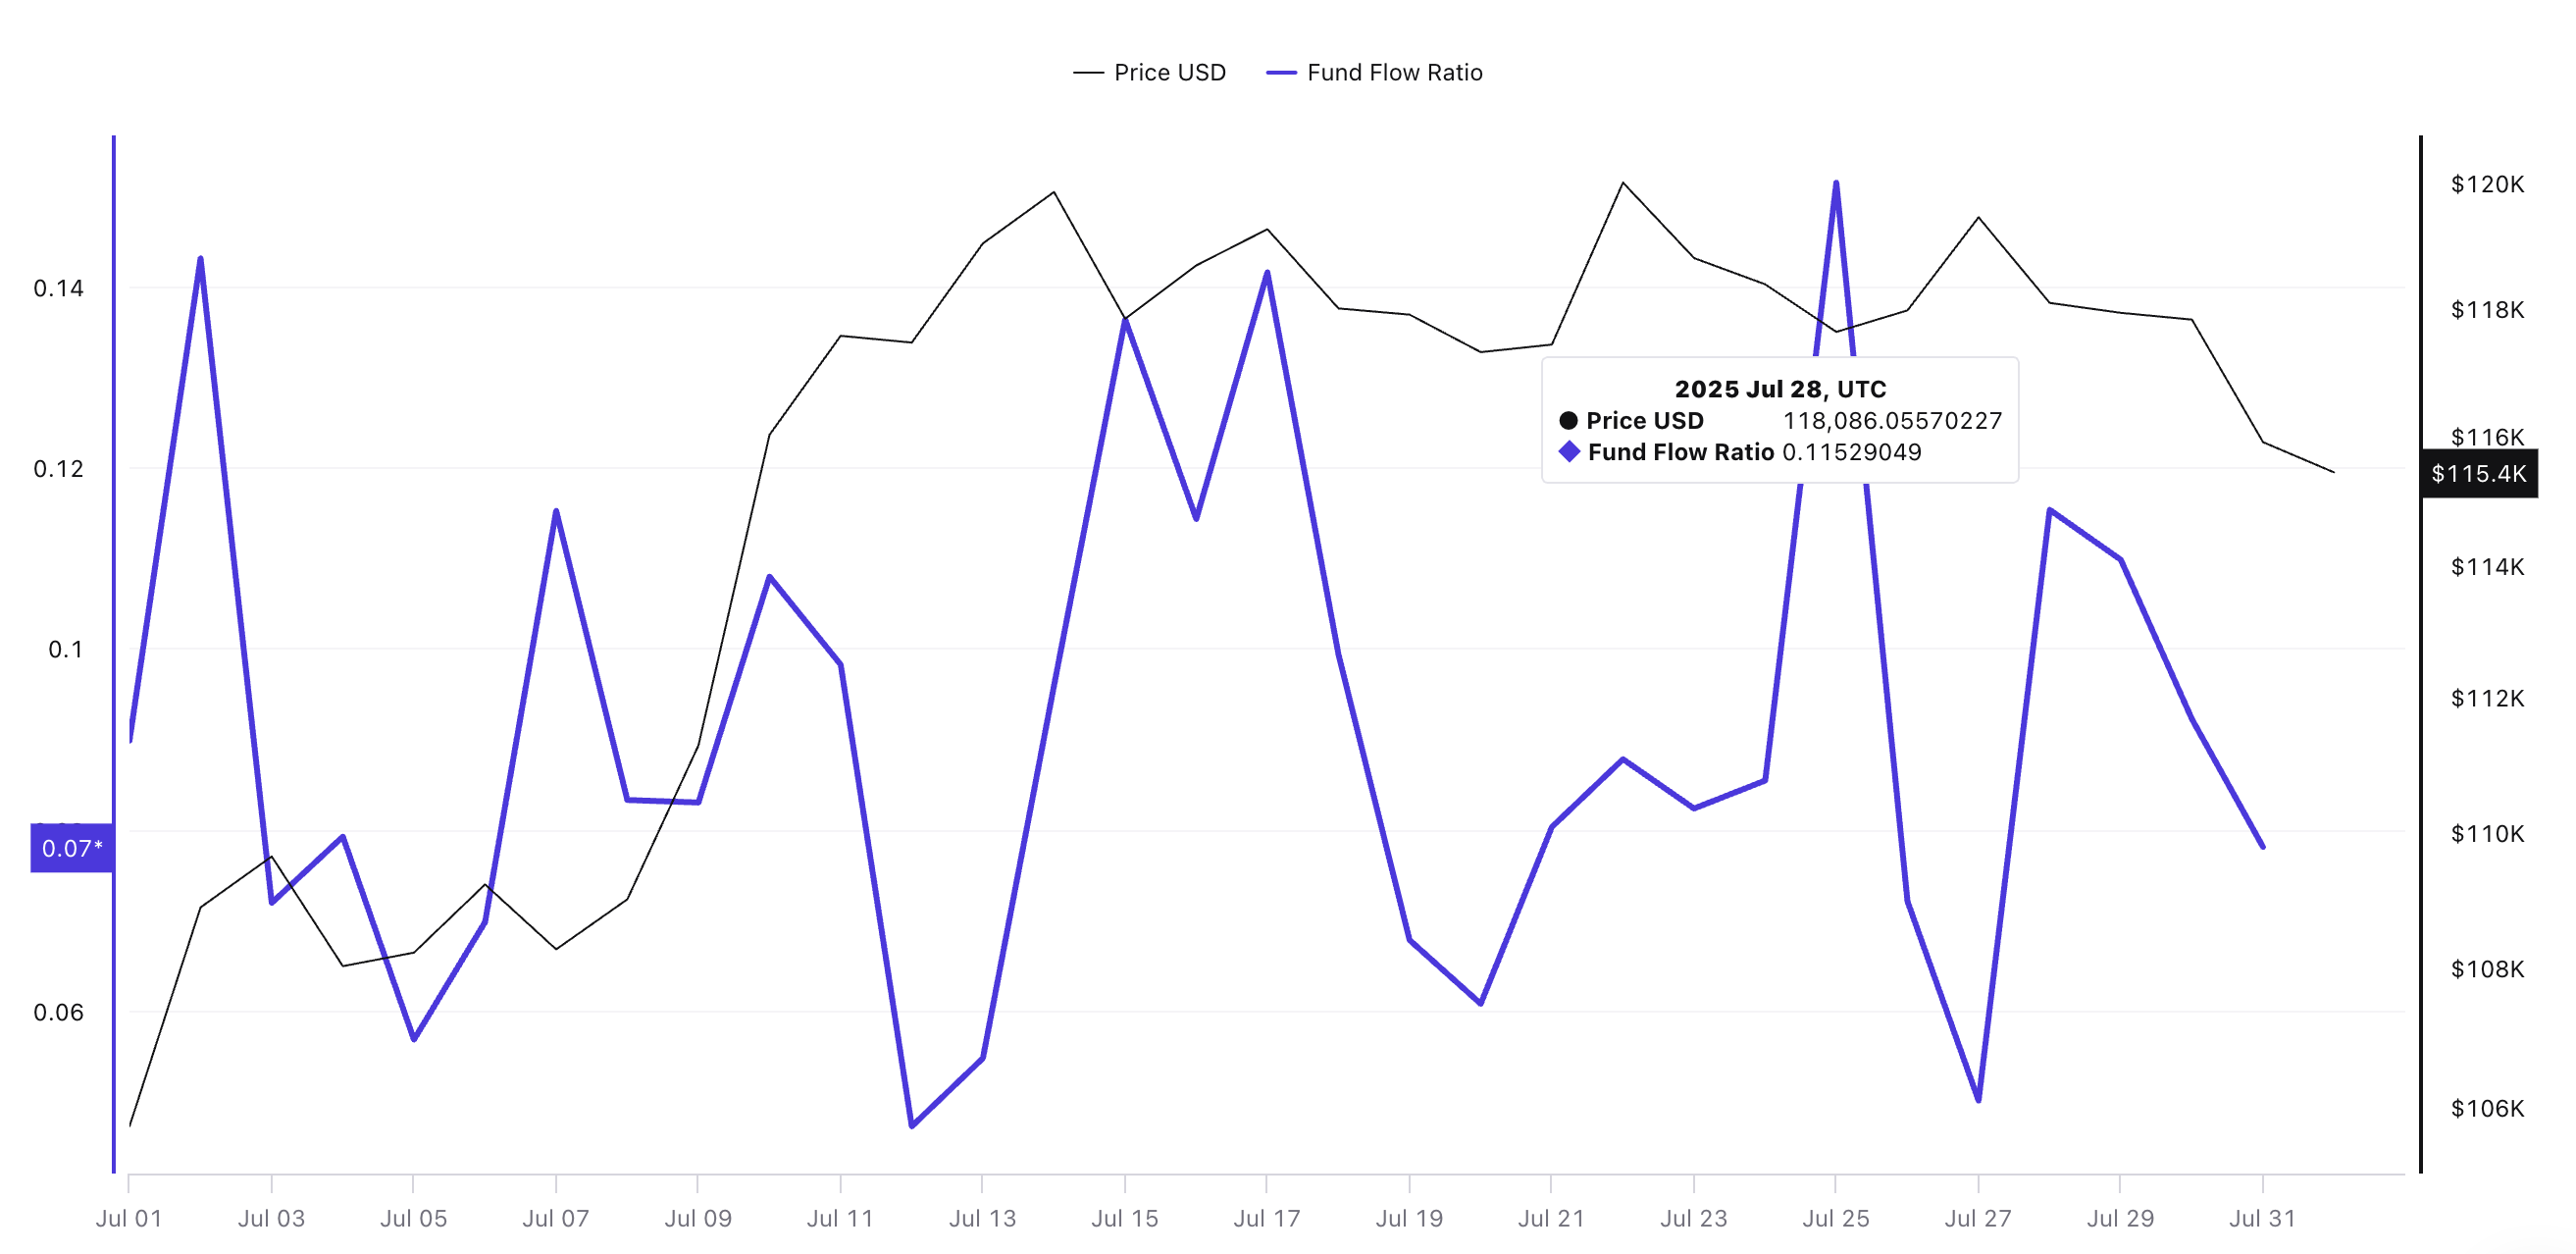 Bitcoin price and fund flow ratio: Cryptoquant
 Over the past two weeks, this ratio has shifted notably:
- Earlier in July, it reached 0.15, matching Bitcoin’s recent peak near $120,000, indicating heightened selling potential.
- By July 28, it had dropped to 0.11, making a lower high. (First lower high since early July, the point where prices surged)
At press time, it has dropped to 0.07. This downtrend in the Fund Flow Ratio suggests that fewer big players are looking to sell. Coins are staying in wallets or moving off exchanges, creating a possible supply squeeze that could help fuel a breakout if buying pressure increases.
For token TA and market updates: Want more token insights like this? Sign up for Editor Harsh Notariya’s Daily Crypto Newsletter here.
CMF Divergence Shows Quiet Accumulation
The Chaikin Money Flow (CMF) is a metric that tracks buying and selling pressure using both price and volume. A higher CMF value indicates strong capital inflows, while a drop signals outflows.
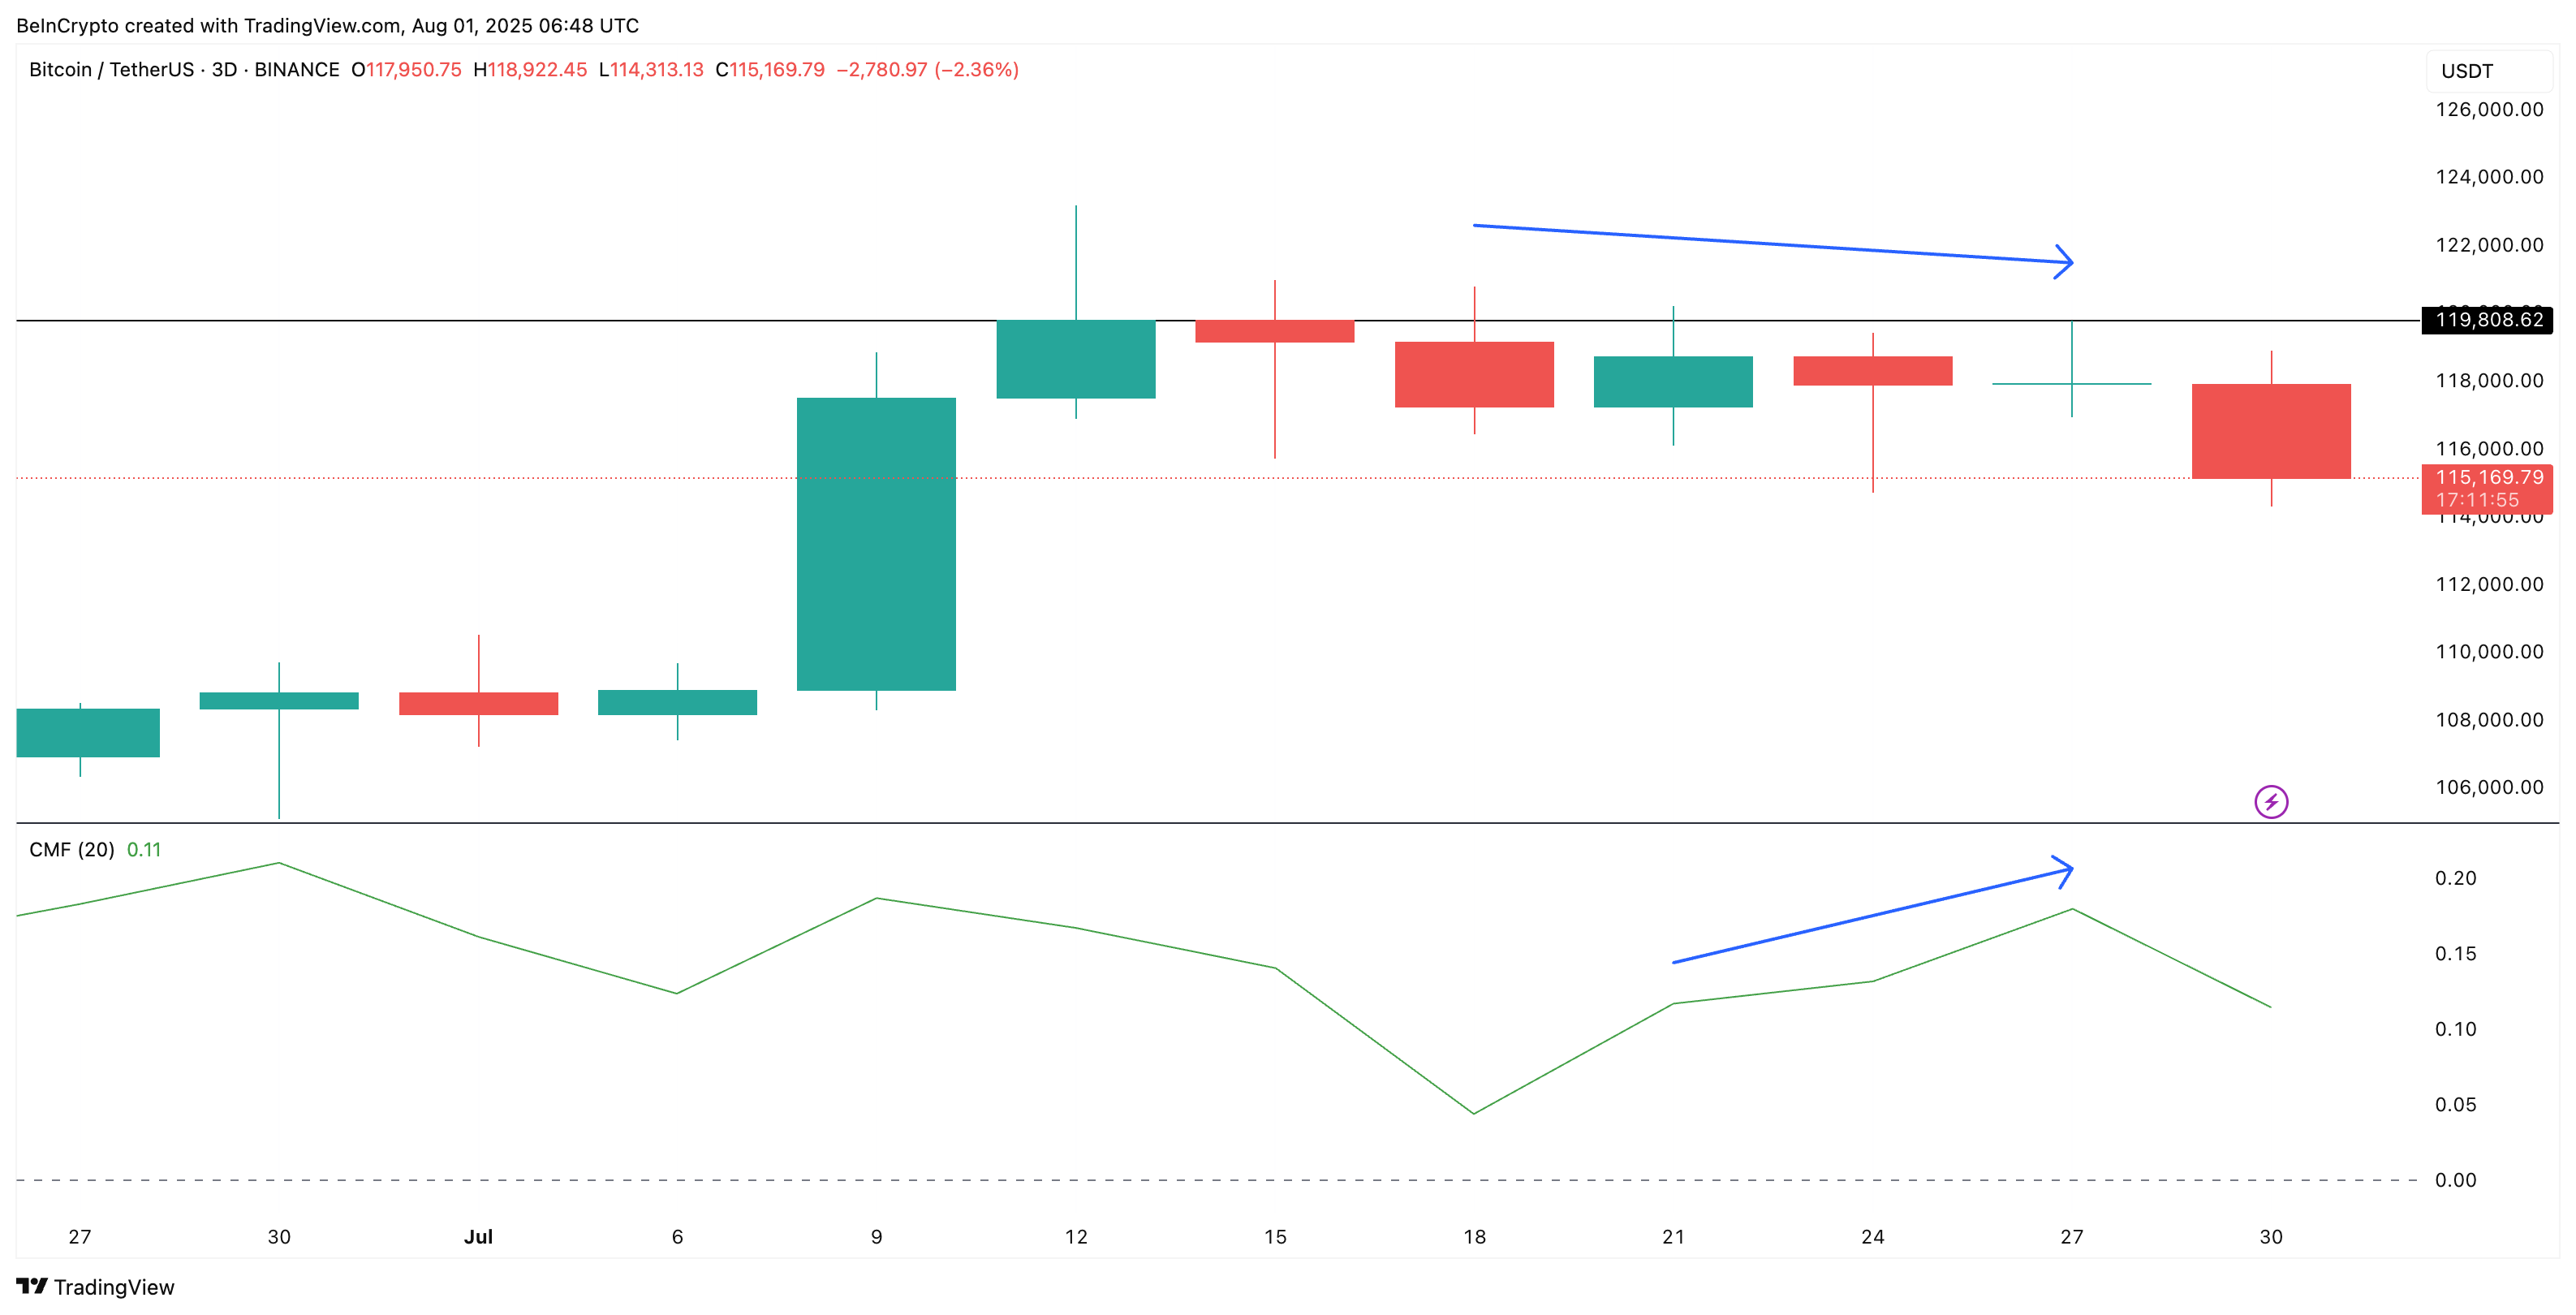 Bitcoin price and CMF divergence (3-day chart): TradingView
 On the 3-day chart, a bullish divergence has formed:
- Price has been making lower highs since mid-July.
- At the same time, CMF has been making higher highs.
This divergence is crucial because it suggests that money is flowing into Bitcoin despite the price dips.
The choice of a 3-day chart is deliberate; it smooths out noise from daily volatility and fake breakouts, giving a clearer view of where big money is positioning. Higher timeframe divergences like this often lead to strong directional moves when resistance breaks.
Currently, the CMF is around the 0.11 mark, and if it moves up from here, forming another higher high, we could get a bullish confirmation for a pattern breakout.
Bullish Pennant Pattern Holds the Key $150,000 Bitcoin Price
The 3-day chart shows a classic pole and pennant structure:
- The pole: A sharp 25% rally earlier this month.
- The pennant: A converging consolidation phase following the surge.
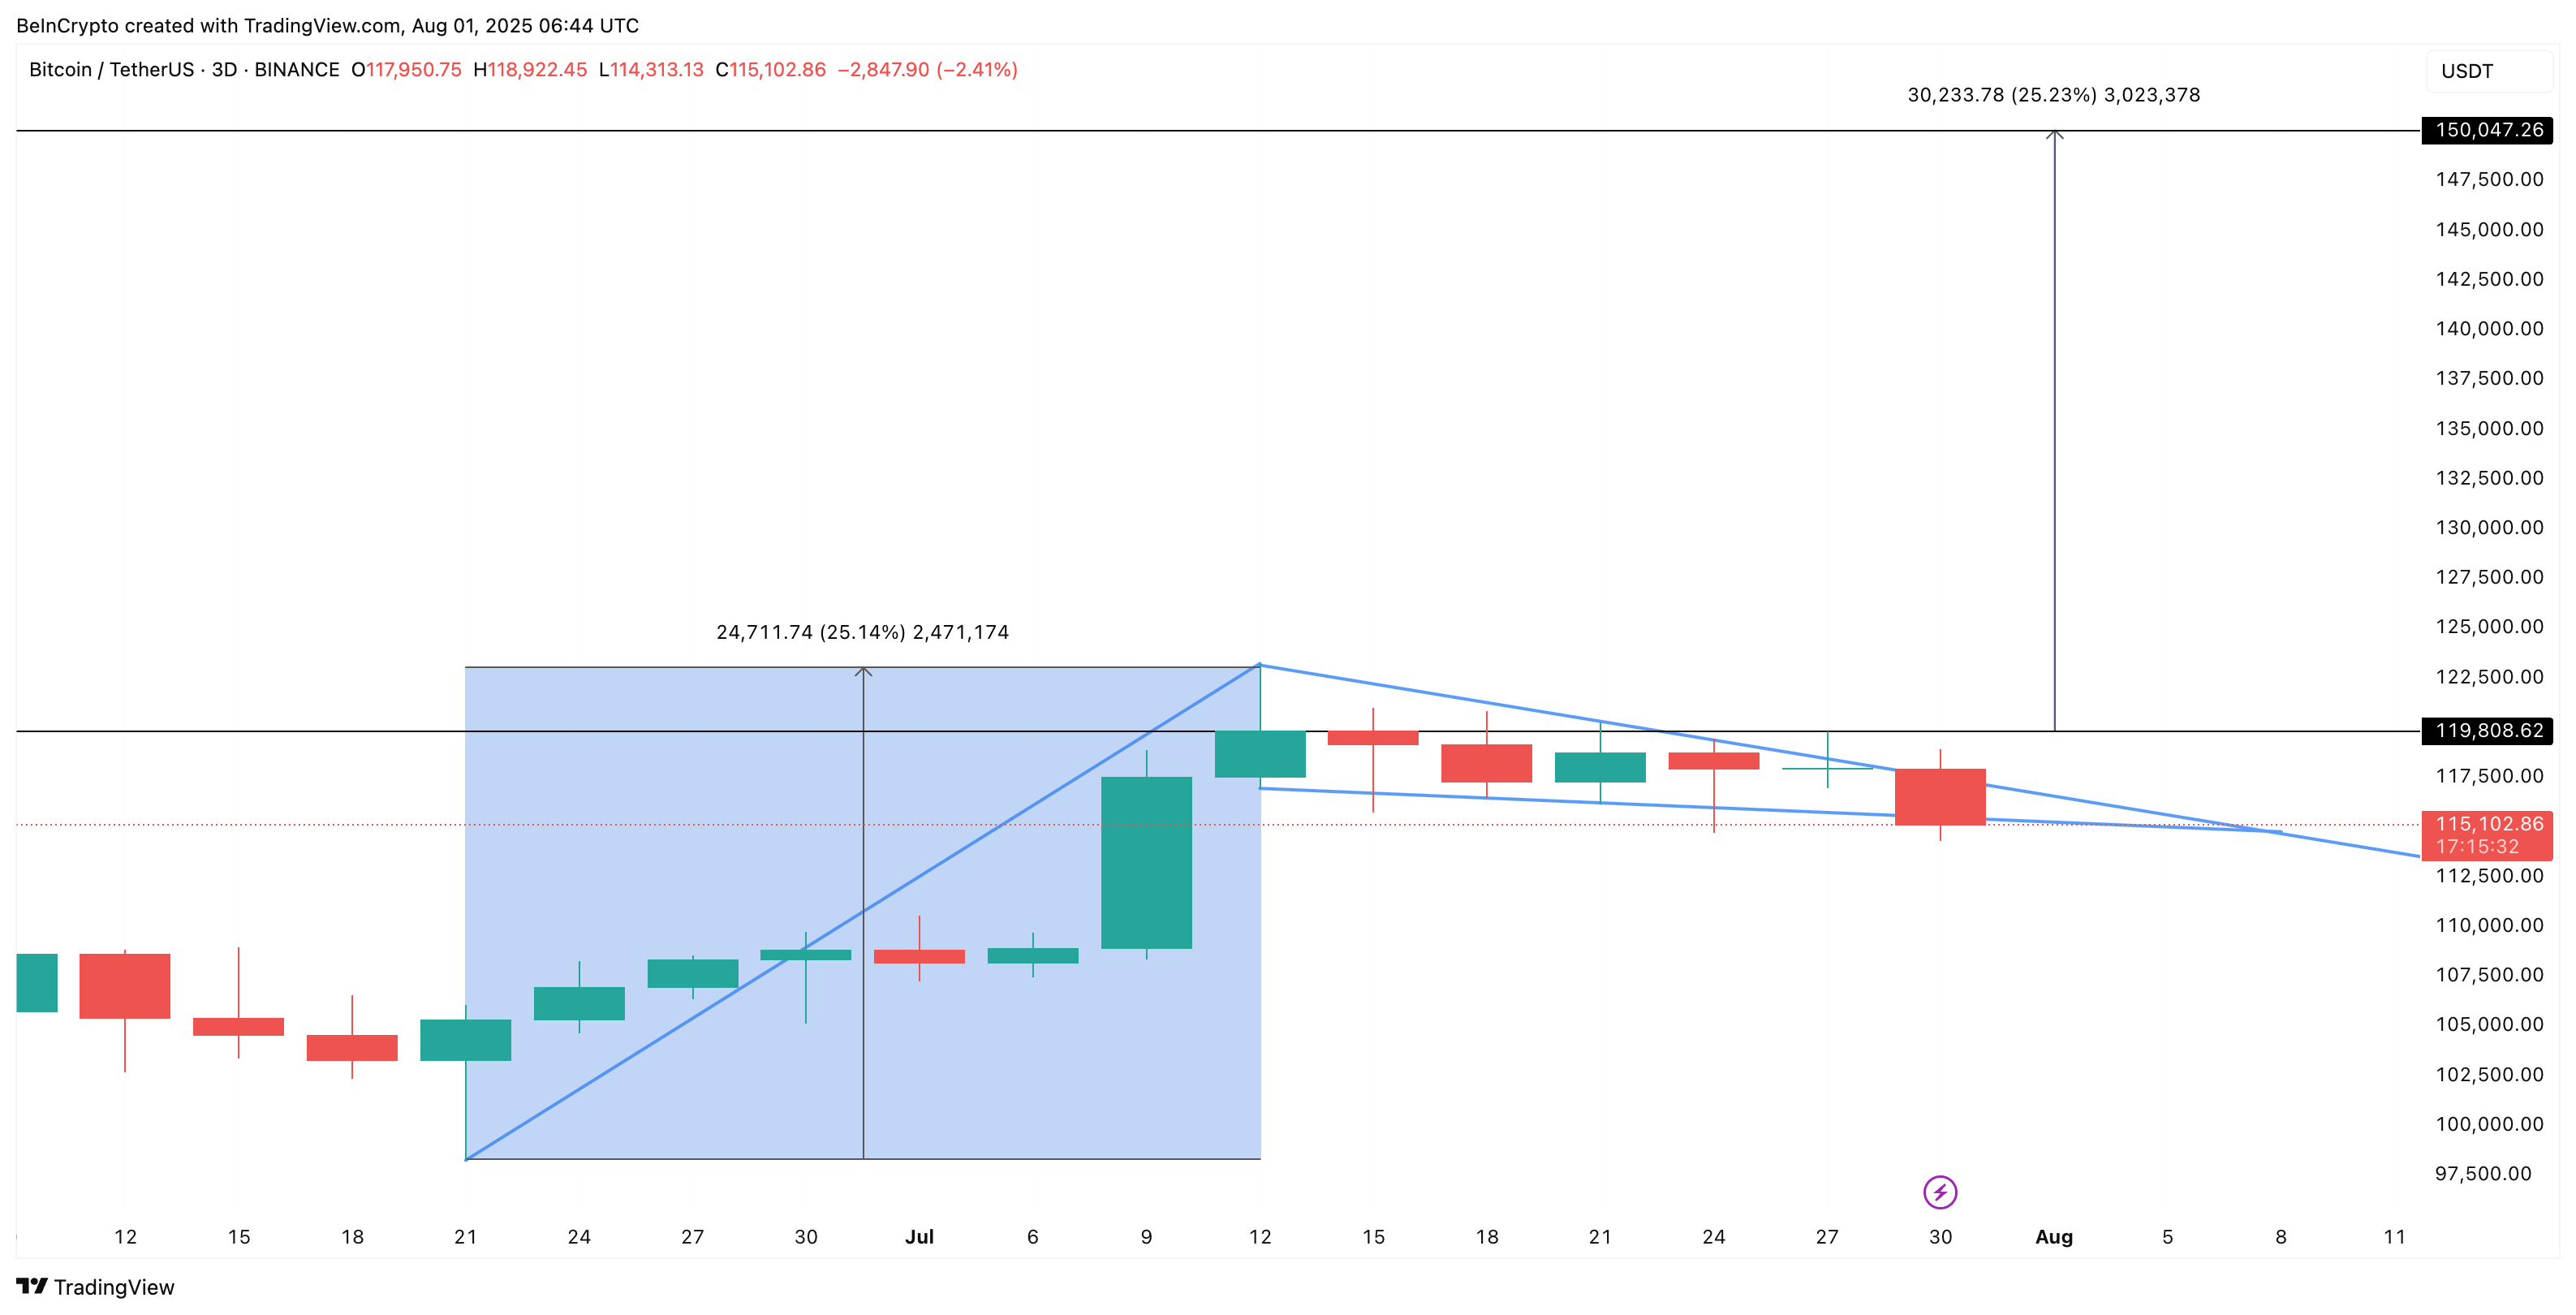 Bitcoin’s pole and pennant structure: TradingView
 This setup typically signals a continuation of the uptrend if resistance breaks. Bitcoin has attempted multiple breakouts, with long wicks above and below trendlines quickly pulled back due to high volatility.
Note: While standard structures and patterns can get invalidated after two false breakouts, pole-based structures have a bigger rope. In most cases, the bullish structure fails if the price drops to close to 50% of the pole’s height. Therefore, the pennant holds for now and remains valid as long as $114,000 support holds.
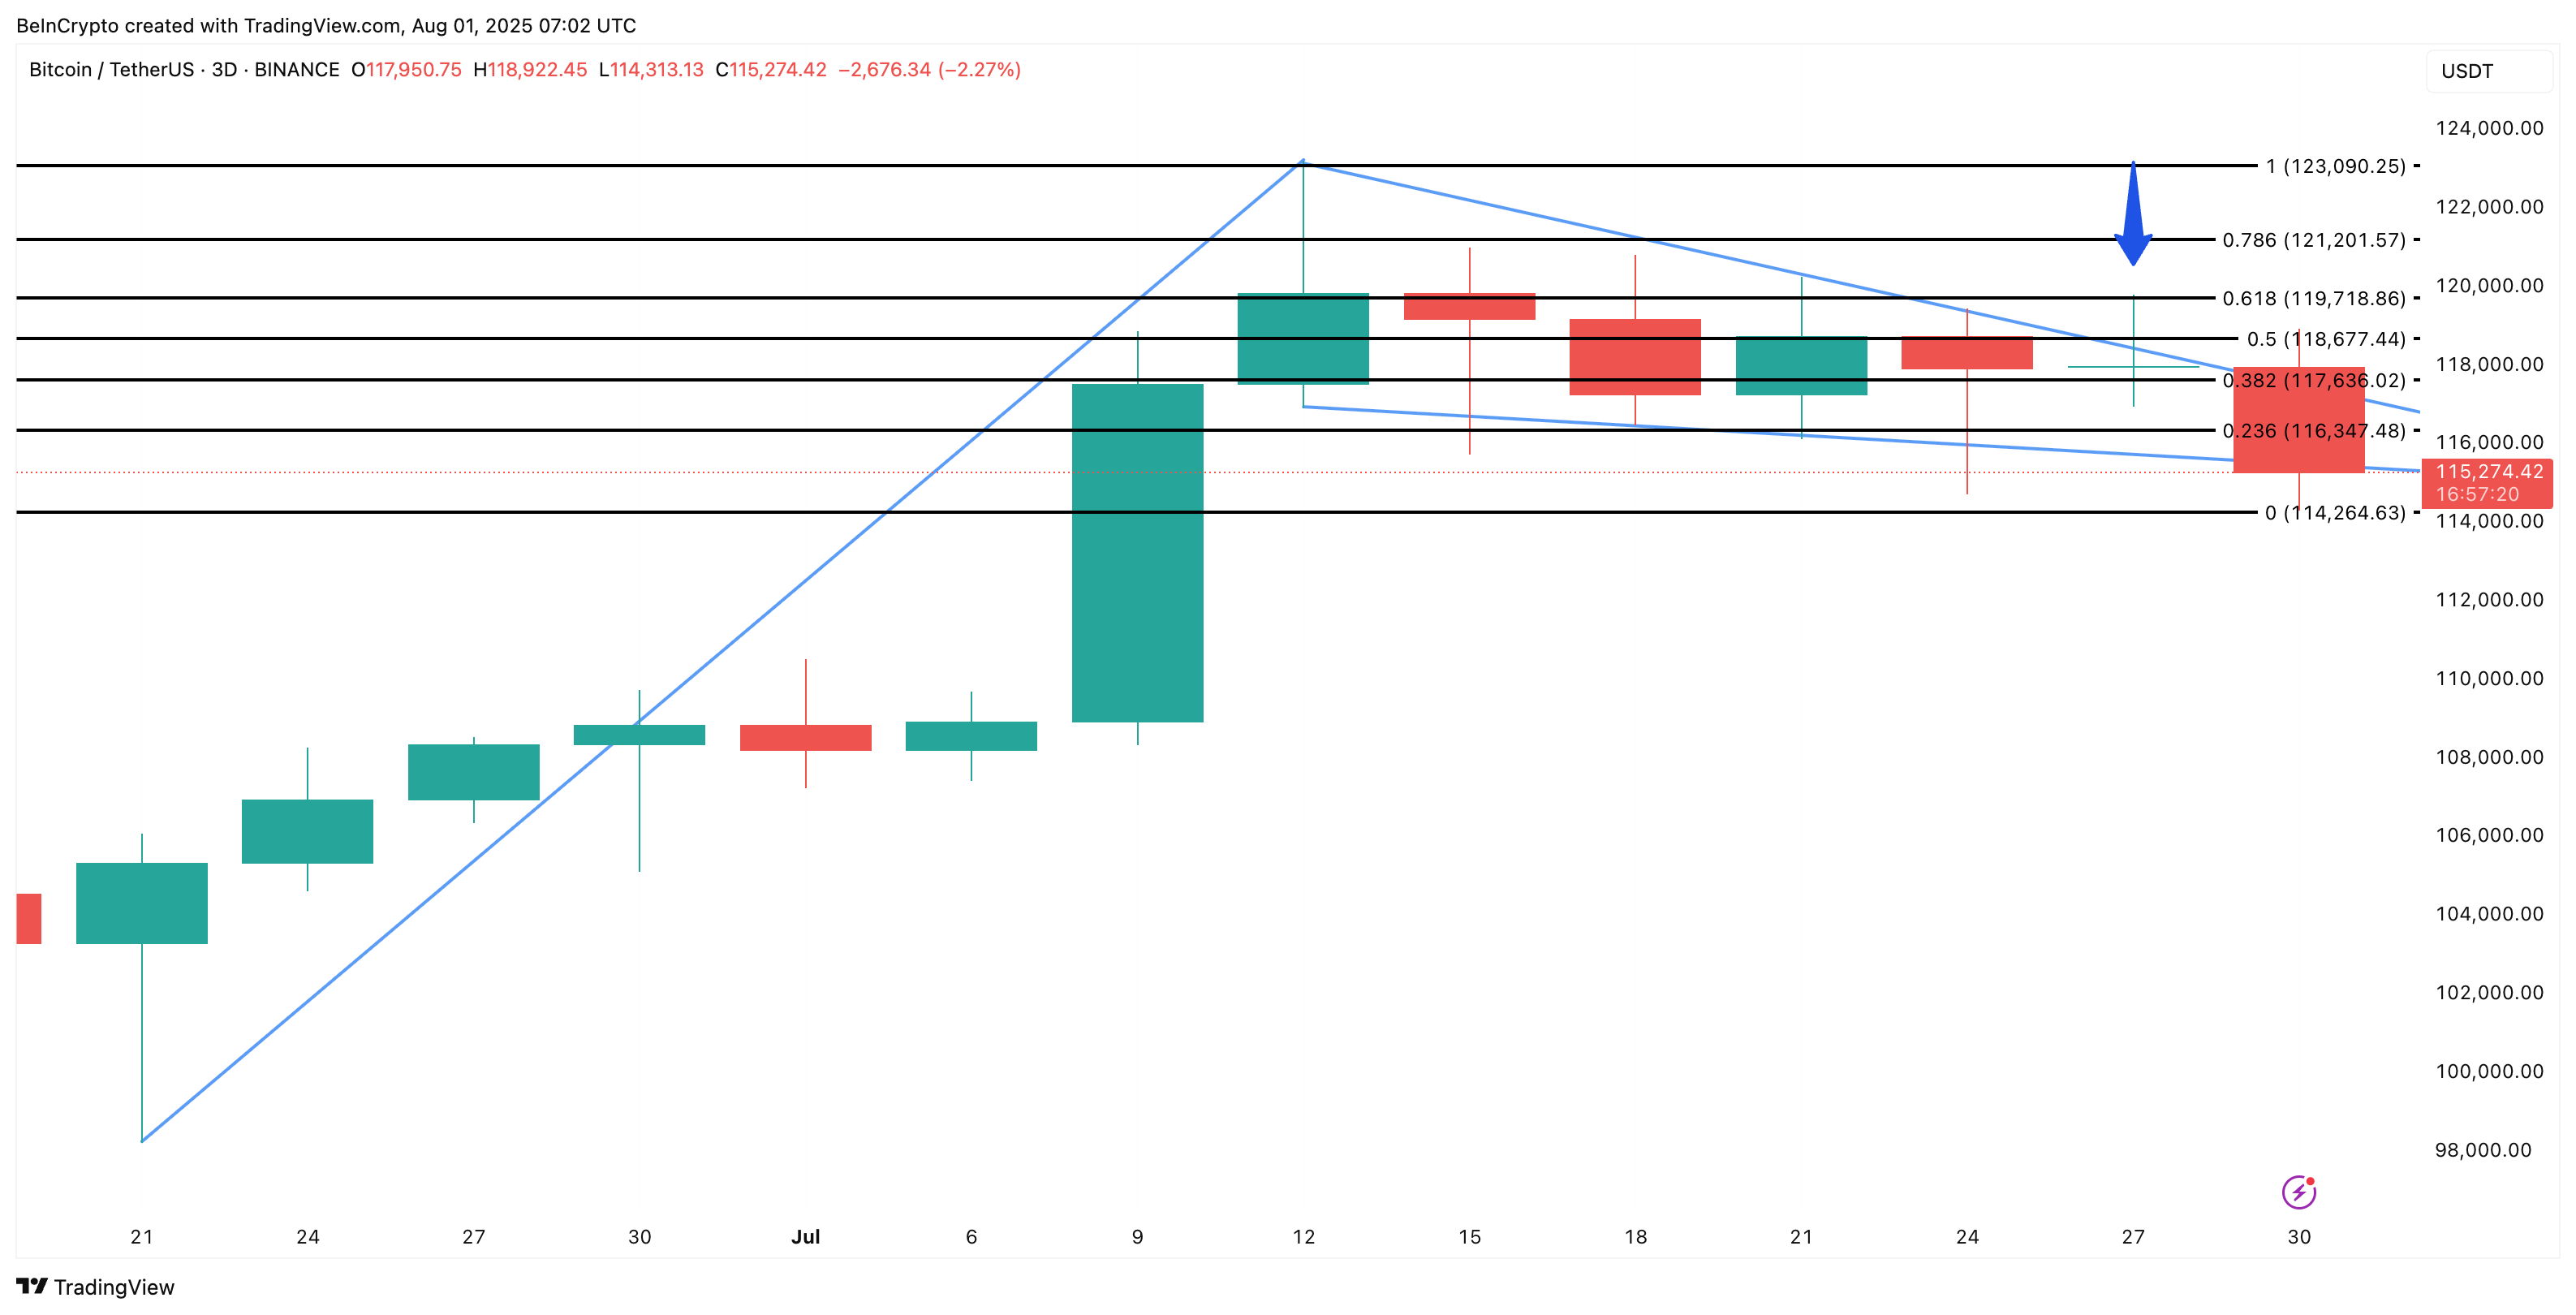 Bitcoin price analysis: TradingView
 A confirmed 3-day full candle close above $119,000 (the highest failed breakout point) would likely trigger the next leg higher. Based on the measured pole move, a 25% breakout from this level could push Bitcoin to around $150,000, aligning with long-term bullish expectations.
Bitcoin’s next big move hinges on a single technical setup. The bullish pennant, backed by reduced exchange outflows and stronger capital inflows on the 3-day CMF, paints a constructive picture for bulls. But it all comes down to price action:
- Above $119,700: Opens the door for a potential surge toward $150,000.
- Below $114,000: The bullish setup fails, and downside risk increases.