Chainlink (LINK) is currently trading above critical Fibonacci support levels, signaling a bullish trend. Analysts anticipate a breakout above $42 if LINK reclaims the $20 resistance zone, supported by strong accumulation and rising trendlines.
-
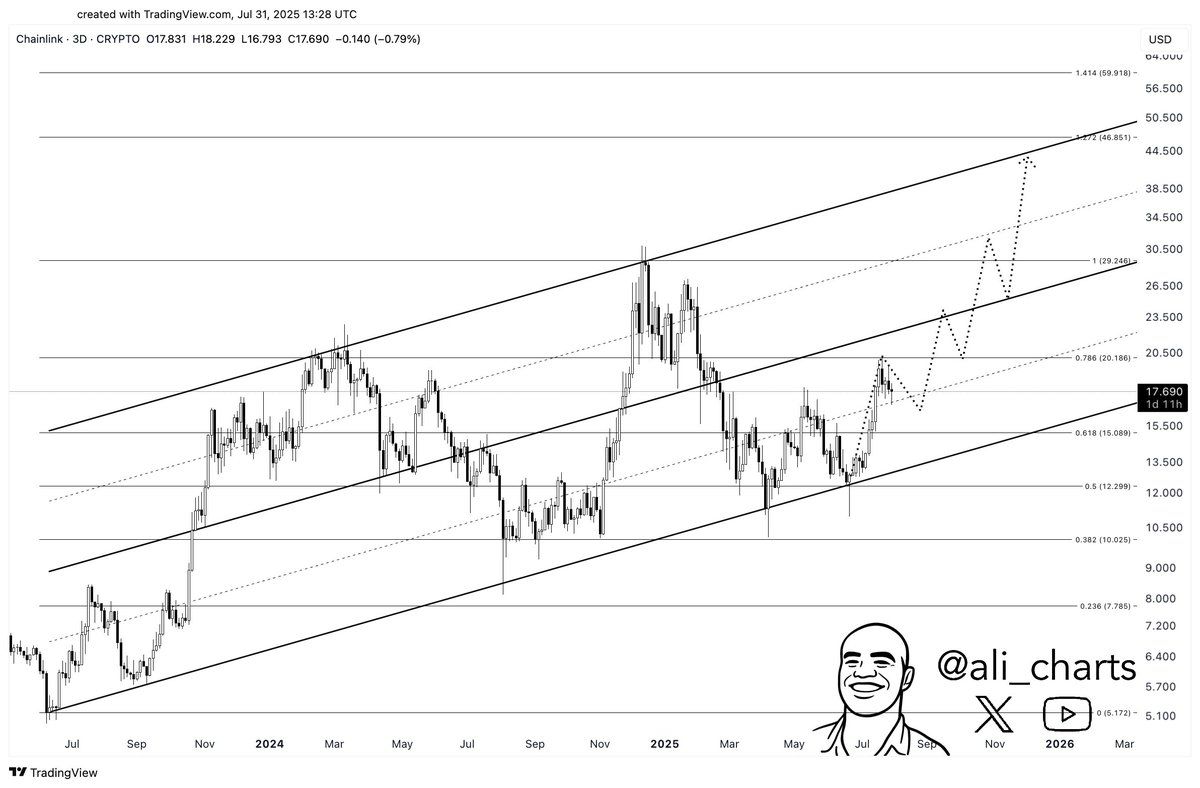
LINK holds above the 0.618 Fibonacci level, confirming a bullish structure since mid-2025 with higher lows and channel support.
-
A double-bottom breakout above $15.39 indicates continuation, with $31 as the next key resistance level.
-
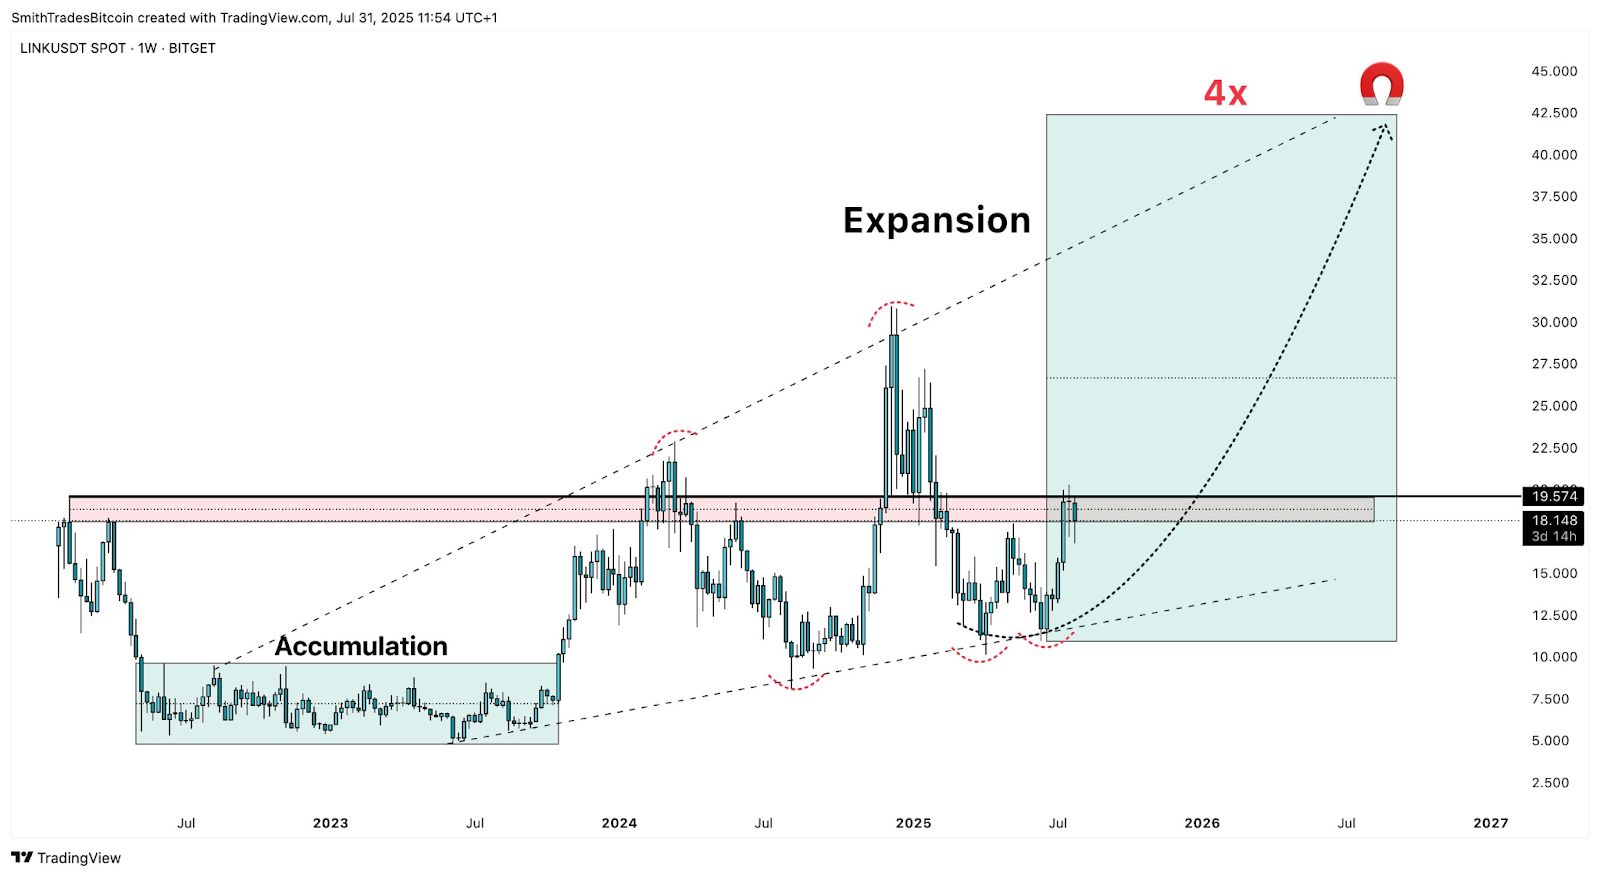
Weekly data projects a $42.50 upside target if LINK surpasses $20, backed by long-term accumulation and trendline confluence.
Chainlink price analysis reveals strong bullish signals above key Fibonacci levels, targeting $42 breakout. Stay informed with COINOTAG’s expert insights.
How Does Chainlink’s Fibonacci Structure Support a Bullish Trend?
Chainlink (LINK) maintains a solid bullish structure by trading above the 0.618 Fibonacci retracement level, a key indicator of upward momentum. Since mid-2025, LINK has formed higher lows within a rising channel, reinforcing positive market sentiment. This Fibonacci support acts as a foundation for potential price advances toward $20 and beyond.
What Does the Double-Bottom Formation Indicate for LINK’s Price?
The double-bottom breakout above $15.39, identified on daily charts, signals a strong continuation pattern. This formation, confirmed by a higher low above $16, suggests that LINK is poised to test the $31 resistance level. Historical accumulation between $13 and $15 strengthens this bullish outlook, providing a solid base for upward movement.
Why Is the Weekly Breakout Significant for Chainlink’s Long-Term Growth?
Weekly analysis reveals that LINK’s breakout from an extended accumulation zone between $5 and $9.50 has initiated a rising channel since late 2023. Resistance between $17 and $20 has been tested multiple times, but current trendline support and momentum indicate a likely push past $20. This breakout aligns with broader market cycles and could propel LINK toward $42.50, reflecting sustained investor interest and strategic positioning.

What Are the Key Resistance and Support Levels for LINK?
Analyst Ali charts highlight critical resistance at $20.186, $26.500, and $30.244, with a potential breakout target of $44.861 based on the 1.272 Fibonacci extension. Support levels to watch include $15.089 and $12.299, with a breakdown below $10.025 risking a drop toward $7.78. These levels provide a clear roadmap for traders monitoring LINK’s price action.
How Does Market Psychology Influence LINK’s Price Movement?
Market sentiment remains bullish as traders respond to strong accumulation zones and technical patterns. The absence of significant price congestion between $19.55 and $31 suggests a smooth upward trajectory. Expert analysis emphasizes the importance of holding above key support to sustain momentum and capitalize on breakout opportunities.
Chainlink Price Comparison Table
| $15.39 | Double-bottom breakout | Supports bullish continuation |
| $20.00 | Key resistance zone | Breakout target for $42.50 rally |
| $42.50 | Projected upside target | Aligned with Fibonacci extension |
Frequently Asked Questions
What technical indicators suggest a Chainlink breakout?
Key indicators include LINK trading above the 0.618 Fibonacci retracement, a double-bottom breakout at $15.39, and a rising channel pattern that has held since mid-2025, all pointing to a potential breakout above $42.
Why is the $20 resistance level important for LINK?
The $20 level acts as a critical resistance zone that, once reclaimed, could trigger a strong upward move toward $42.50, reflecting renewed investor confidence and trendline support.
Key Takeaways
- Strong Fibonacci Support: LINK holds above 0.618 Fib level, confirming bullish momentum.
- Double-Bottom Breakout: Break above $15.39 signals continuation toward $31 resistance.
- Weekly Trendline Support: Rising channels and accumulation zones suggest a breakout above $42.50.
Conclusion
Chainlink’s price action demonstrates a robust bullish structure supported by key Fibonacci levels, double-bottom formations, and rising trendlines. With critical resistance at $20 in focus, a breakout could propel LINK toward $42.50, aligning with long-term growth trends. Investors should monitor these technical signals closely as momentum builds.
-
Chainlink (LINK) sustains bullish momentum above critical Fibonacci and trendline support zones, signaling potential for significant price gains.
-
Technical patterns such as double-bottom breakouts and rising channels reinforce optimistic price targets near $42.50.
-
Expert analysis from COINOTAG highlights key resistance and support levels, providing actionable insights for traders.
Chainlink price analysis reveals strong bullish signals above key Fibonacci levels, targeting $42 breakout. Stay informed with COINOTAG’s expert insights.
Chainlink’s Fibonacci Levels and Trendline Support Drive Bullish Outlook
Chainlink (LINK) is trading above the 0.618 Fibonacci retracement level, confirming a bullish structure that has formed higher lows since mid-2025. This trend is supported by a parallel rising channel that has guided price action for over a year, indicating sustained upward momentum. Analysts project resistance at $20.186, $26.500, and $30.244, with a potential breakout target of $44.861 according to Fibonacci extensions.
Double-Bottom Breakout Signals Continuation Toward $31 Resistance
A double-bottom pattern confirmed by a breakout above $15.39 suggests a bullish continuation. Price action has respected this neckline, with a higher low forming above $16. This pattern supports a move toward the $31 resistance level, with minimal price congestion expected between current levels and this target. Historical accumulation in the $13–$15 range further strengthens this outlook.
Weekly Chart Analysis Aligns with Long-Term Growth Targets
Weekly data shows LINK breaking out from an accumulation zone between $5 and $9.50, entering a rising channel since late 2023. Resistance between $17 and $20 has been tested multiple times, but current momentum and trendline support indicate a likely breakout above $20. This move could trigger a rally to $42.50, consistent with past market cycles and long-term growth trajectories.
Conclusion
Chainlink’s price action is supported by key Fibonacci retracement levels, double-bottom breakout patterns, and rising trendlines, all signaling bullish momentum. With critical resistance at $20, a breakout could lead to a significant rally toward $42.50. Traders should watch these levels closely as LINK’s technical setup aligns with long-term growth potential.