Stellar (XLM) Bears Strengthen Control as $0.50 Remains Out of Reach
Stellar’s XLM has plummeted 11% over the past week as bearish sentiment spreads across the broader crypto market.
With sellers regaining control, the altcoin faces mounting pressure and risks falling further from the desired $0.50 level.
XLM Bears Push Price Deeper Below Key Levels
On a daily chart, XLM’s double-digit dip has pushed its price below the 20-day exponential moving average (EMA). The 20-day EMA now forms dynamic resistance above the token’s price at $0.4187, increasing the market’s downward pressure.
For token TA and market updates: Want more token insights like this? Sign up for Editor Harsh Notariya’s Daily Crypto Newsletter here.
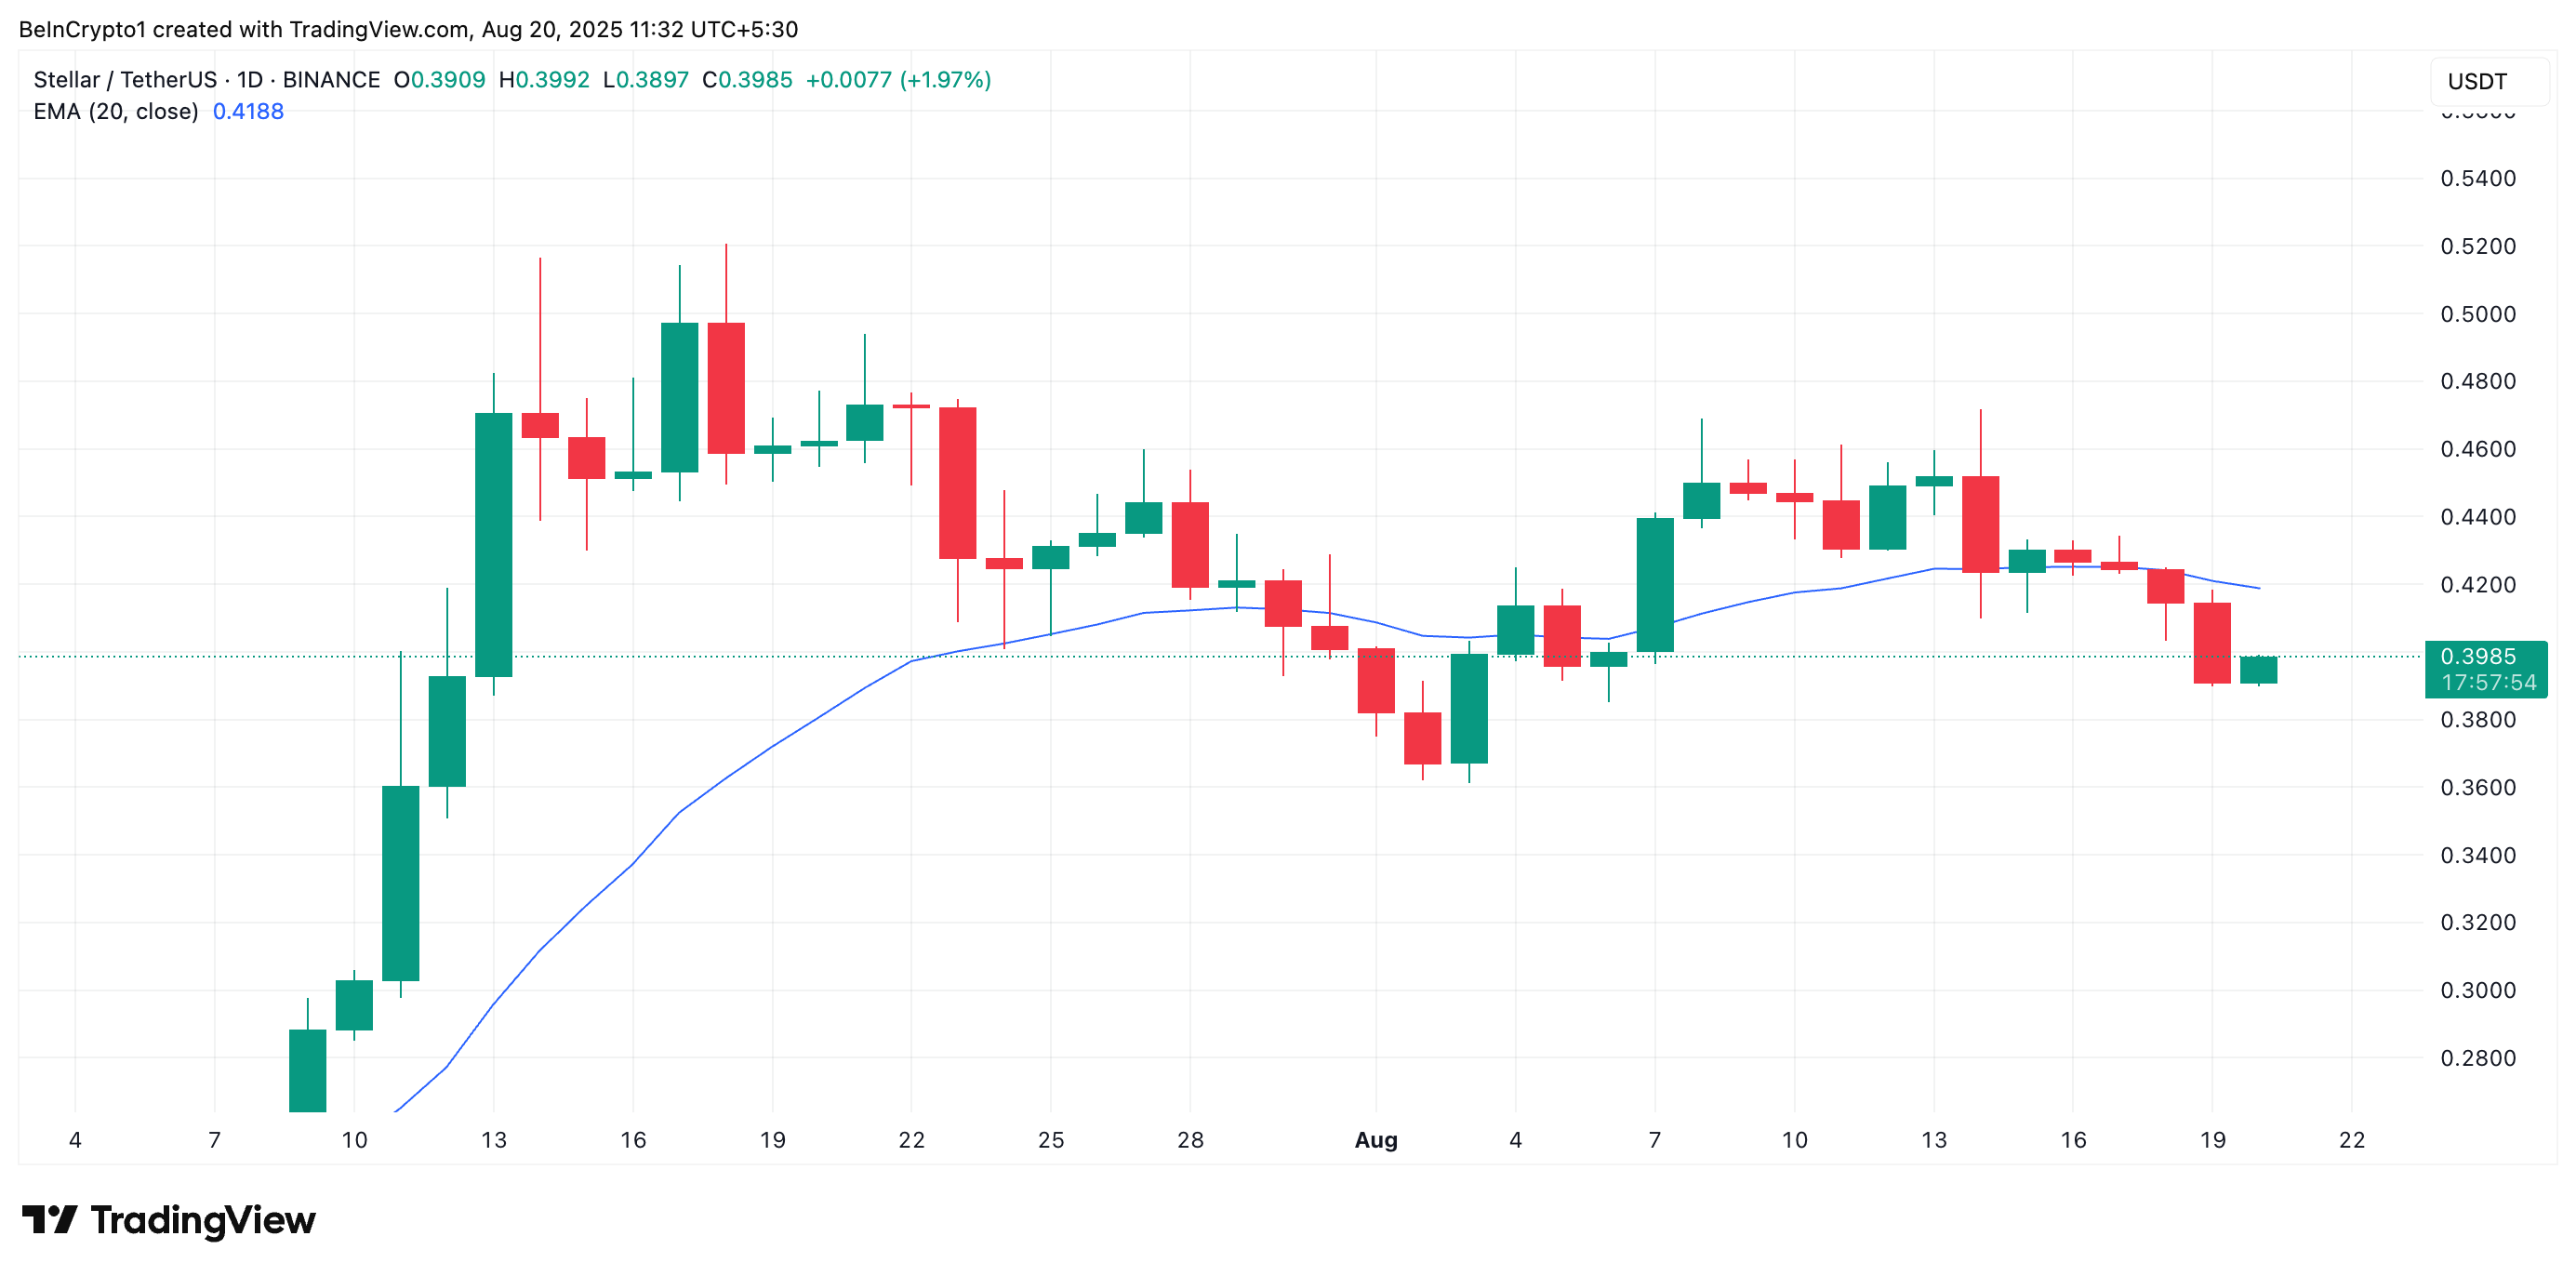 XLM 20-Day EMA. Source: TradingView
 The 20-day EMA measures an asset’s average price over the past 20 trading days, giving weight to recent prices. When price trades above the 20-day EMA, it signals short-term bullish momentum and suggests buyers are in control.
On the other hand, when an asset’s price falls under this level, the market experiences increased sell-side pressure and weakening short-term support. This puts XLM at risk of falling further over the next few days.
Further, XLM’s price has broken below the Leading Span A of its Ichimoku Cloud and is trending lower towards the Leading Span B, confirming the weakening accumulation.
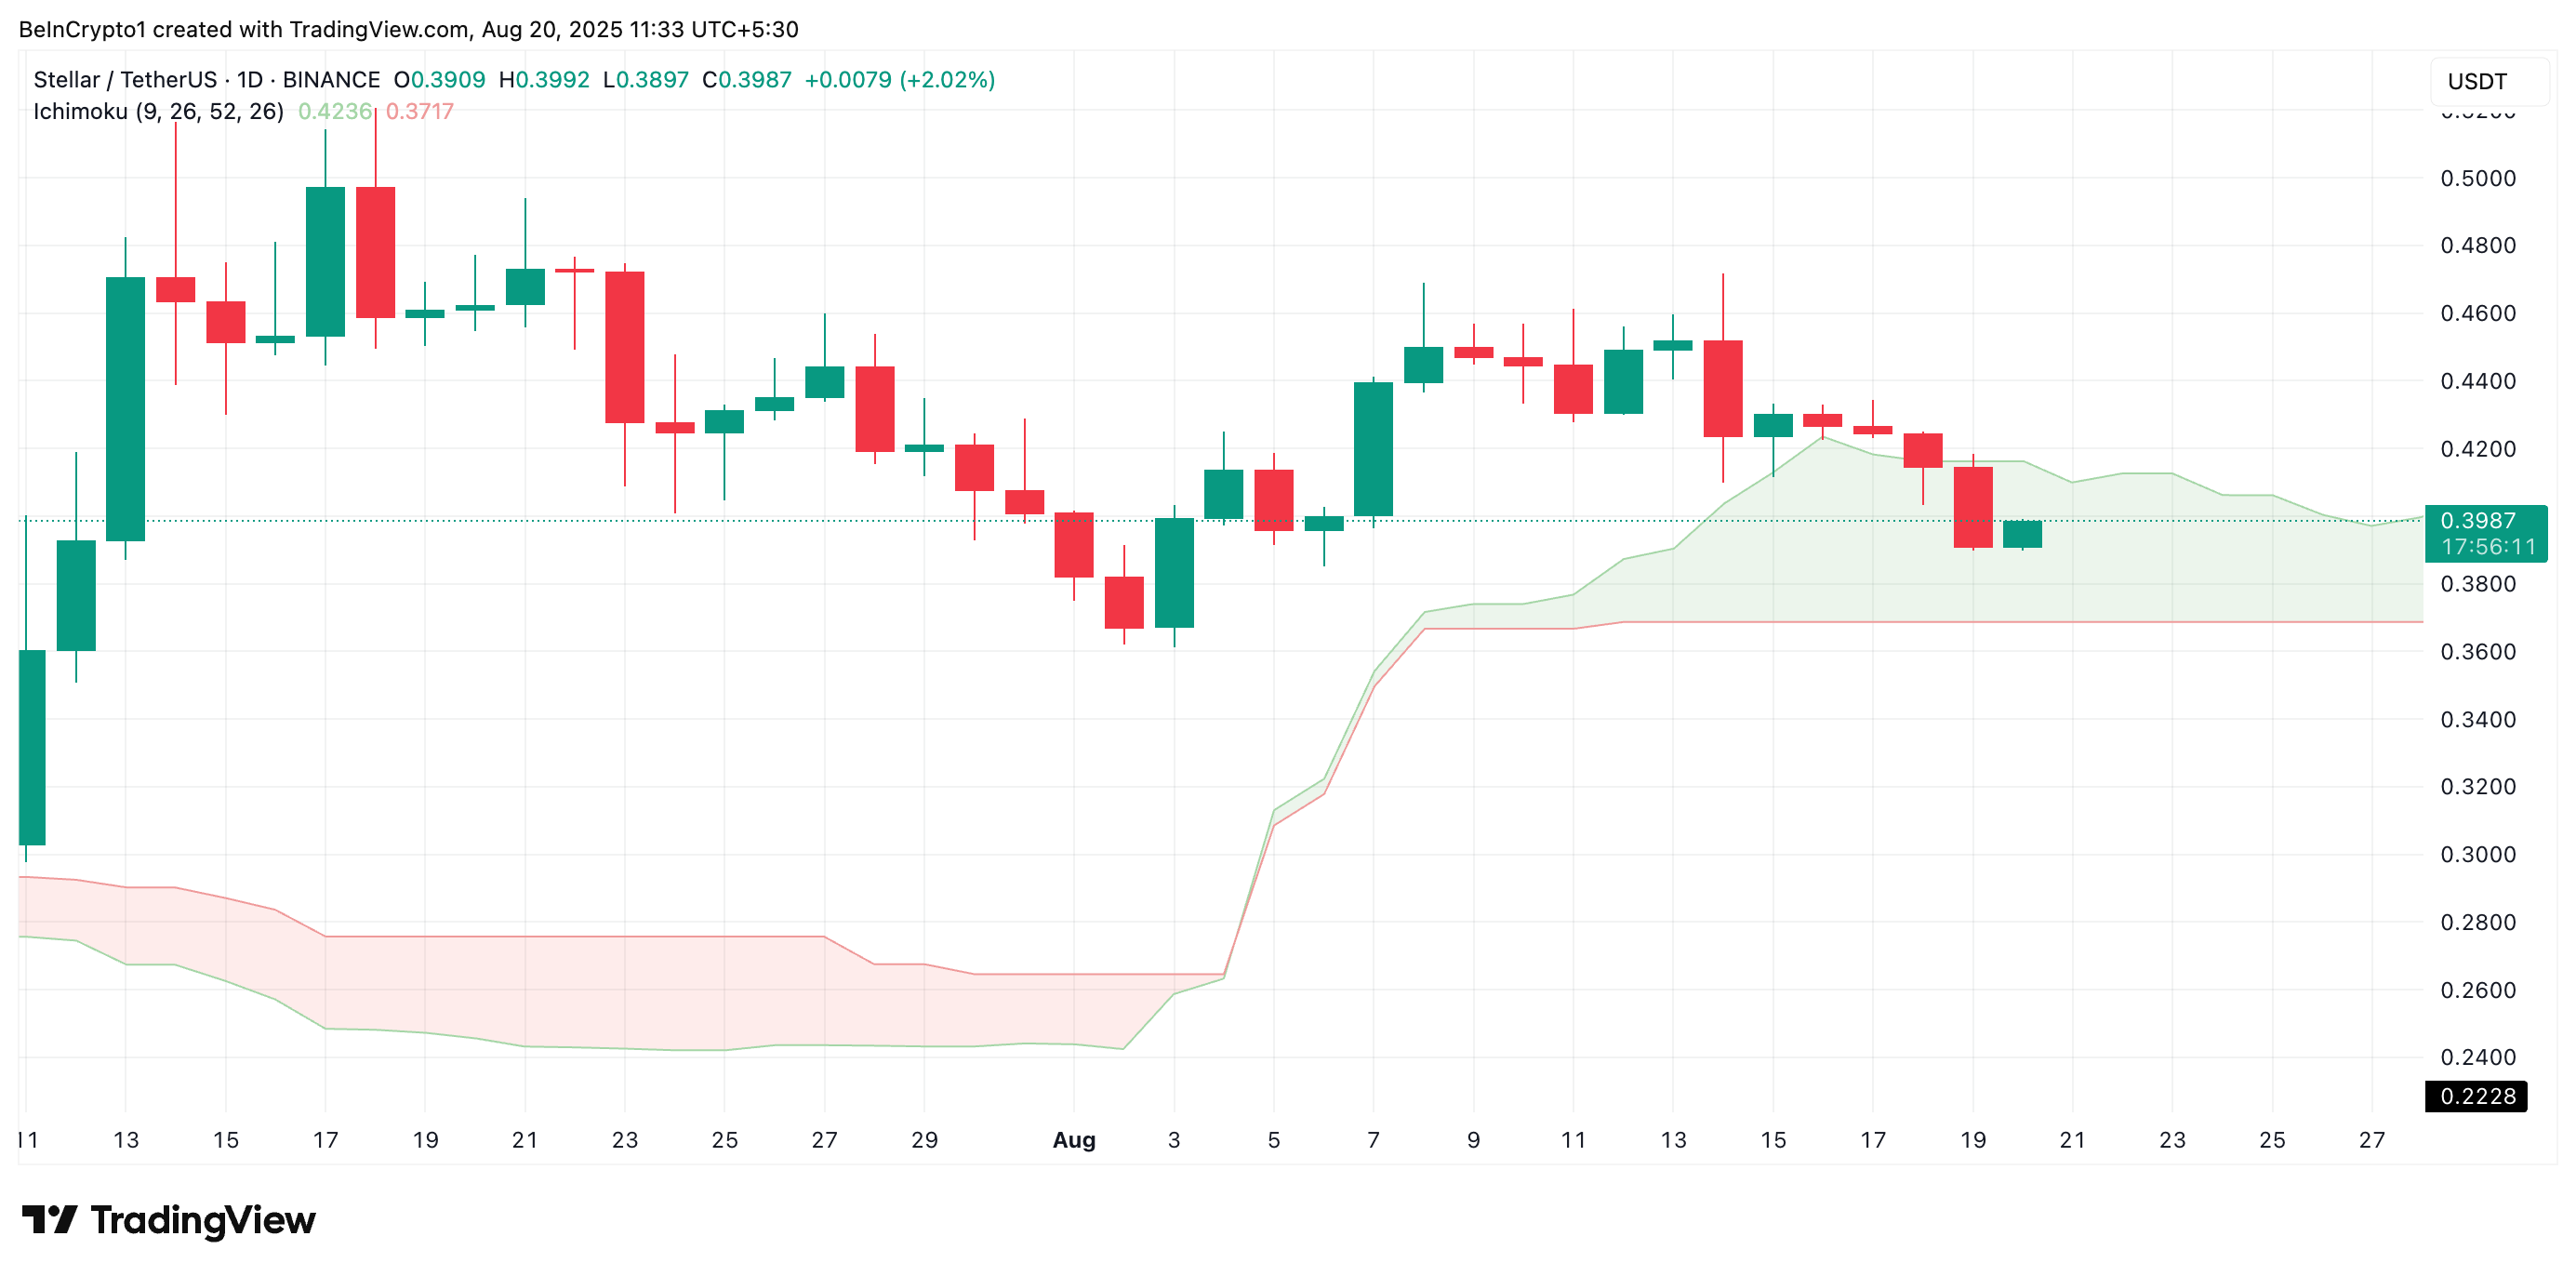 XLM Ichimoku Cloud. Source: TradingView
 The Ichimoku Cloud tracks the momentum of an asset’s market trends and identifies potential support/resistance levels.
When an asset’s price falls beneath the Leading Span A of this indicator, it signals that bearish forces are gaining strength. A subsequent move toward the Leading Span B raises the likelihood of a deeper downside.
Therefore, this trend suggests that XLM’s bearish trajectory could persist unless it manages a decisive rebound above the cloud.
XLM Slides Deeper Into Bear Territory
These indicators highlight a market environment where XLM buyers are increasingly sidelined, giving sellers the upper hand. Unless bulls reclaim control above the Cloud, the altcoin will likely remain in a decline.
In this case, its price could fall toward $0.3717, where the Leading Span B still forms dynamic support. If this level fails to hold, XLM’s value could drop to $0.3620.
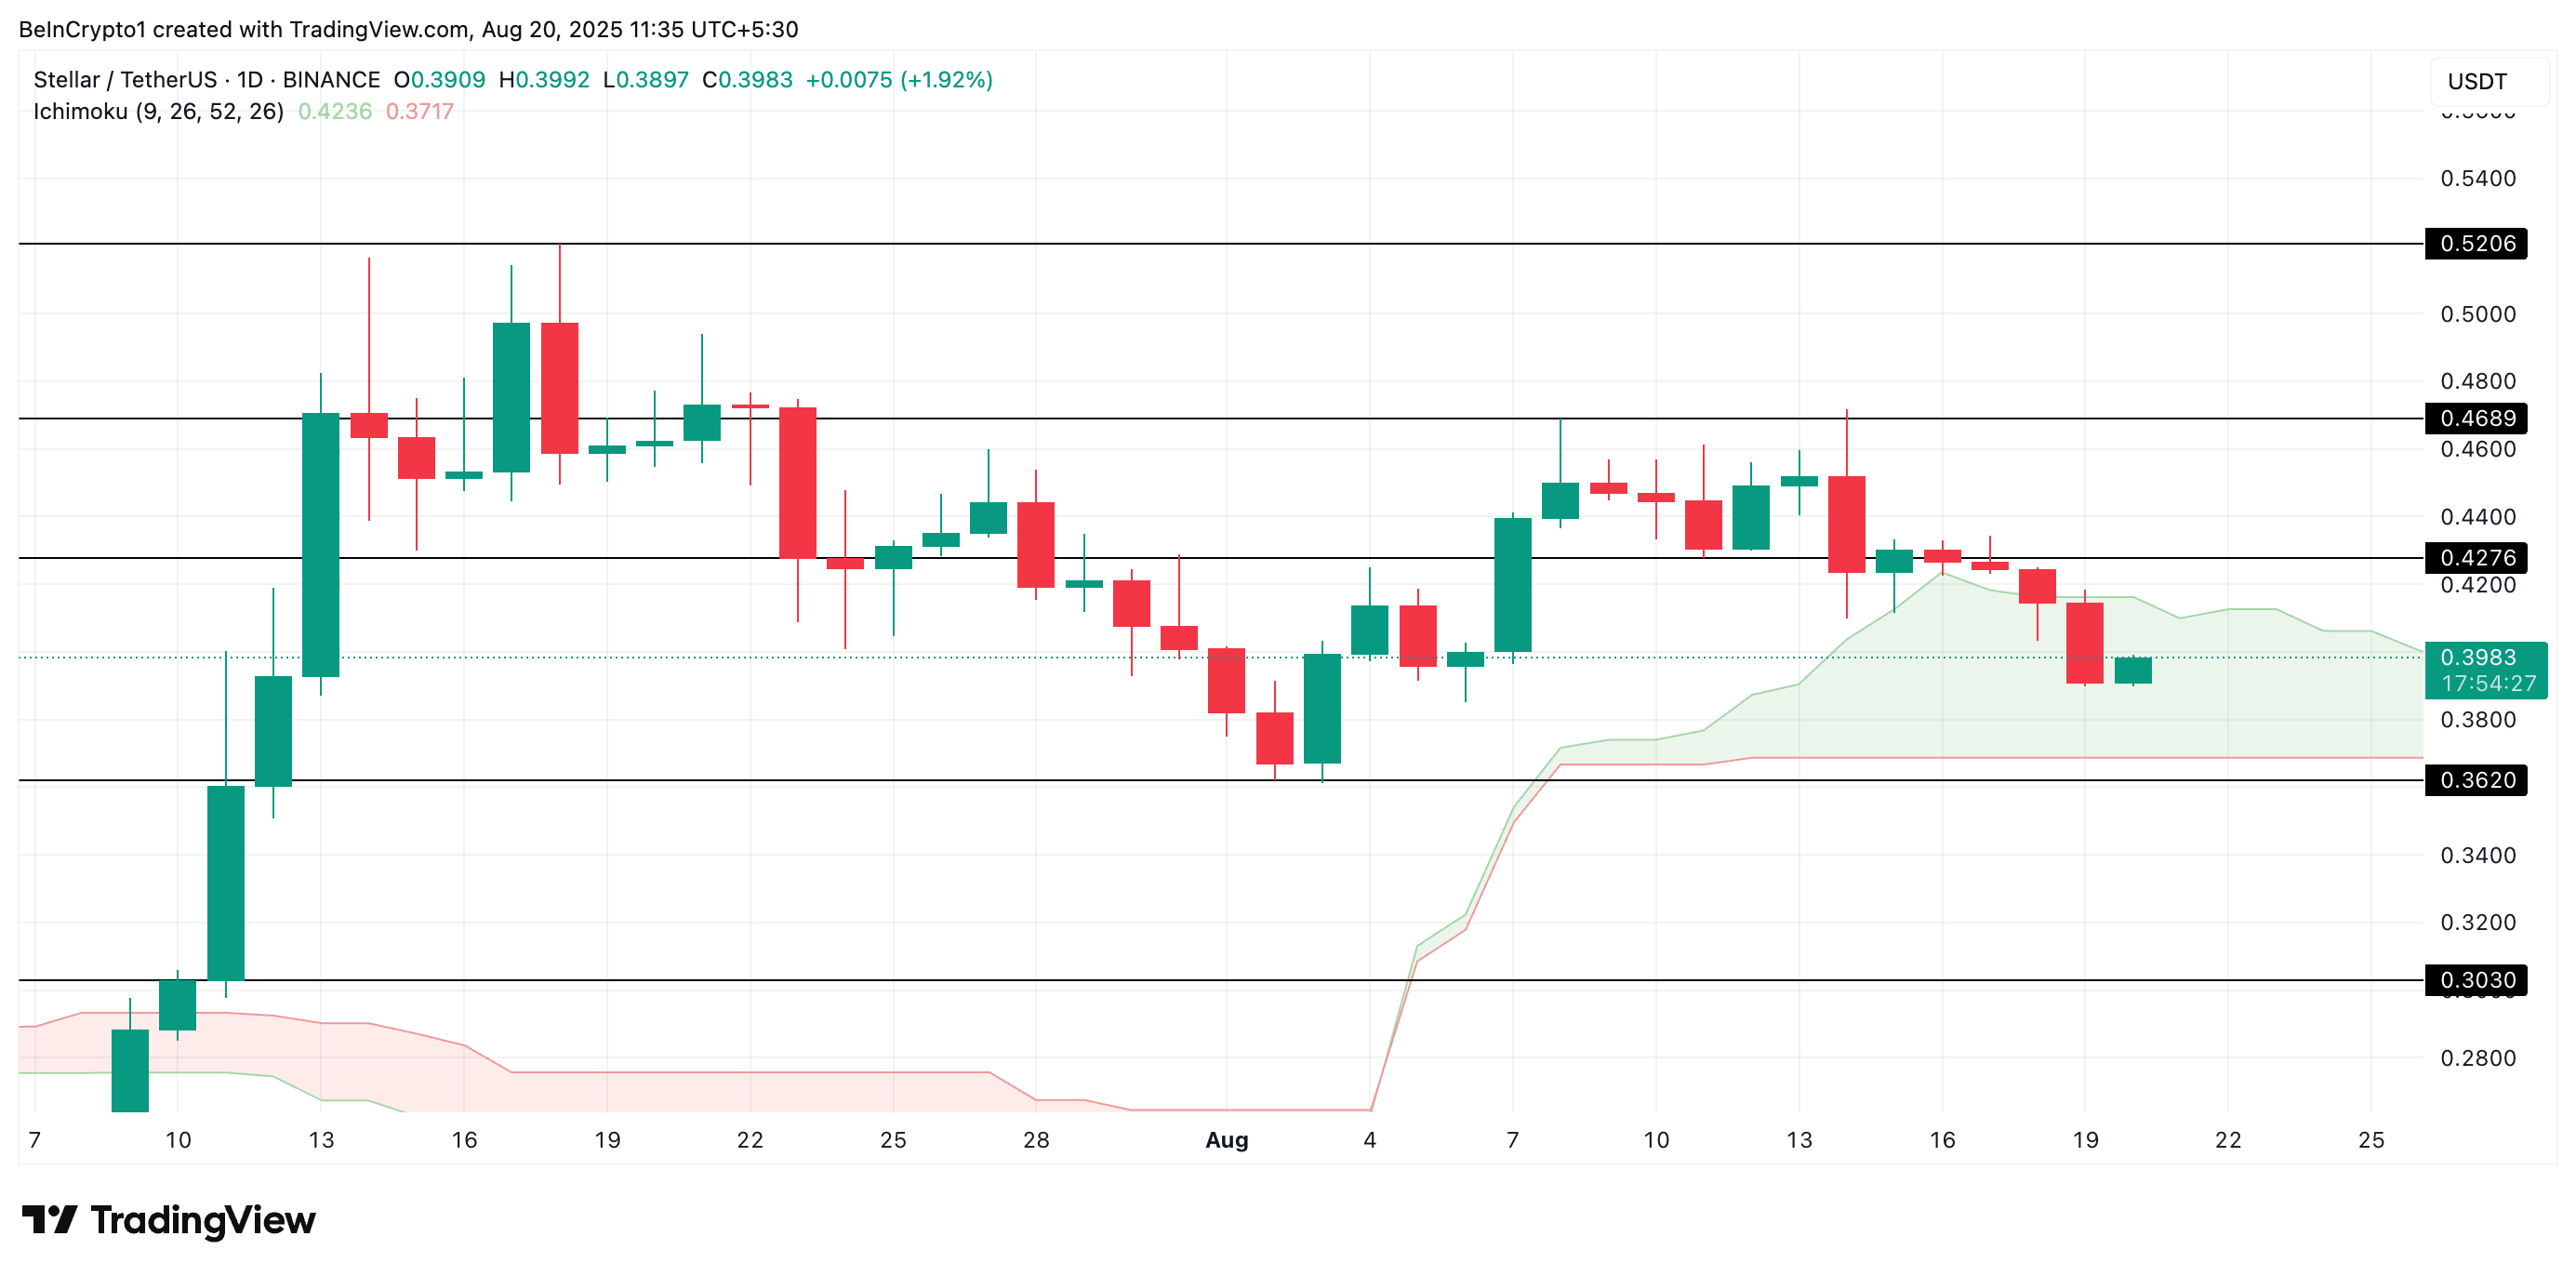 XLM Price Analysis. Source: TradingView
 On the other hand, the token’s price could regain and climb above the Leading Span B at $0.4236 if the bulls regain control.