Bitcoin Faces Post-ATH Correction – Technical Analysis for August 20, 2025
Bitcoin shows signs of bearish pressure after its recent all-time high. Discover the technical outlook for BTC’s future development.

In brief
- Bitcoin consolidates around $113,800, -1.5% over the week, volumes rising.
- Uptrend confirmed mid/long term, but short-term fatigue.
- Open interest declining, high funding rate confirming bullish bias.
- Possible rebound above key supports, risk of correction if broken.
Bitcoin Technical Analysis (BTC/USD)
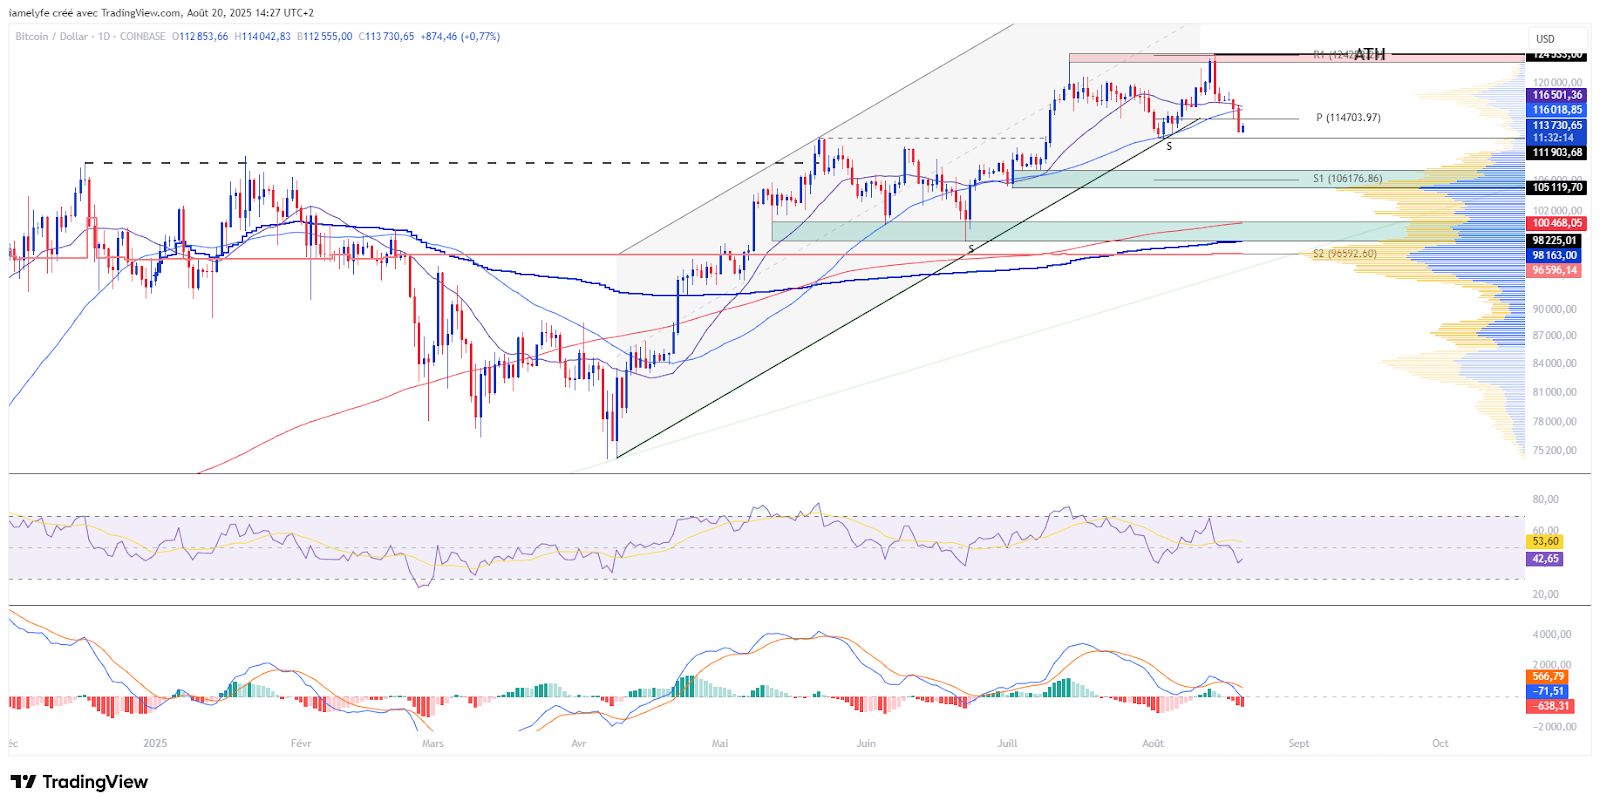
Bitcoin is currently trading around $113,800, after a correction following the failure to maintain the last ATH. Over the week, performance shows a moderate drop of about 1.5%, reflecting a pause in the recent uptrend momentum. Weekly volumes reach $48 billion, up 34%, signaling renewed market engagement despite this technical pullback. On the structural side, the trend remains bullish long-term (SMA 200) and medium-term (SMA 50), confirming a solid underlying dynamic. However, the short-term trend (SMA 20) has neutralized, reflecting fatigue and a possible stabilization or pullback phase. Finally, momentum shows a slight decline without invalidating the bullish backdrop that continues to dominate.
Bitcoin Technical Levels (BTC)
Bitcoin faces a technical setup marked by well-defined reference zones. The main resistance remains at the ATH of $124,533, considered a potential distribution threshold where selling pressure could strengthen. Key supports are at $111,900, $107,400, and $105,200, corresponding to major defense levels and probable accumulation zones. The last daily break at $112,000 allowed resistance to be crossed, opening an expansion phase before a slight correction appeared. The monthly pivot point at $114,703, located below the current price, serves as a benchmark to assess the month’s trend. Finally, value areas structure market balance: the upper bound at $118,145 marks a critical zone whose breach could trigger a bullish imbalance, while the lower bound at $104,620 would represent a warning threshold in case of increased selling pressure.
Market Sentiment
Market sentiment, measured by the Fear & Greed Index, currently indicates a state of fear, reflecting a shift from the previous euphoric phase. Regarding institutional flows, spot Bitcoin ETFs record moderate sell-offs, in line with the recent market evolution.
 BTCUSD Daily Chart
 The current technical analysis was conducted in collaboration with Elyfe , and 0xhugzer , investors and educators in the cryptocurrency market.
Derivatives Analysis (BTC/USDT)
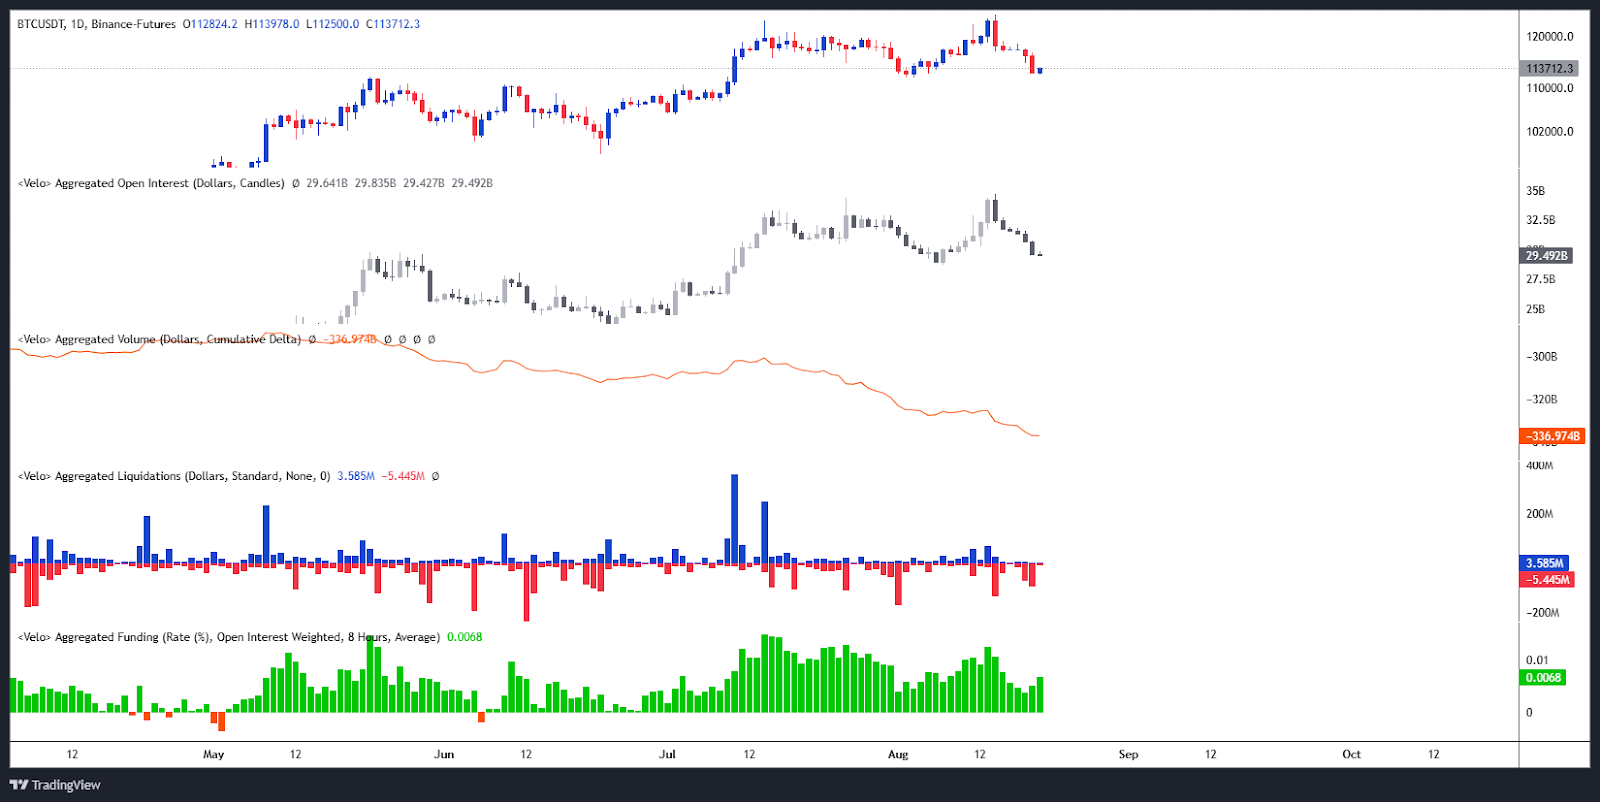
Open interest is decreasing, indicating reduced speculative positioning on derivatives. The CVD highlights selling dominance, with flows oriented towards selling and marked imbalance. Liquidations, moderate, mainly concern long positions. Finally, the funding rate, still high and positive, confirms a bullish bias with a significant premium for long positions, but likely to hinder demand for new short-term exposures.
 Bitcoin Open Interest / Liquidations / CVD & Funding rate
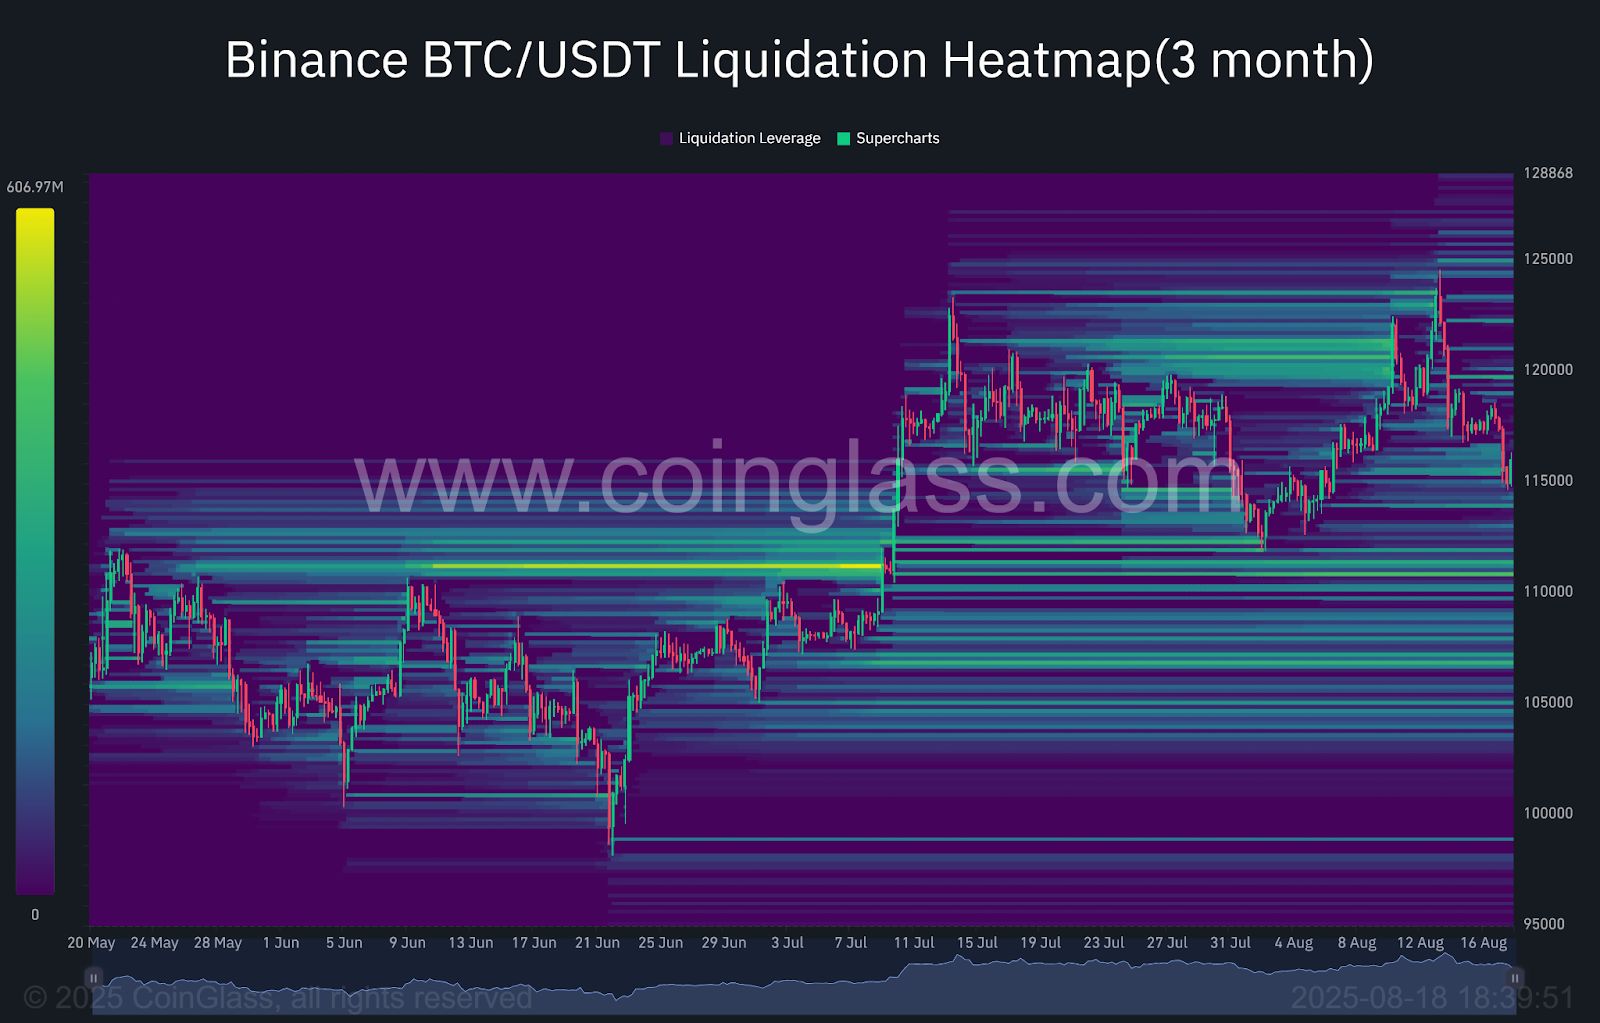
 Selling liquidation zones are identified between $119,750 and $123,050, as well as $125,000. These levels constitute sensitive zones in case of a bullish breakout, with risk of movement amplification if prices cross these thresholds. Downside, several buying liquidation zones are spotted around $111,000 as well as near $107,000 then $105,000. These levels represent critical thresholds likely to trigger flush-type movements if the market breaks these supports. All these zones must be closely monitored, as they structure potential accelerations to come, whether in a continuation bullish scenario or a more pronounced correction.
 BTC Liquidation Heatmap
 Forecasts for Bitcoin (BTC) price
Bullish scenario:
- Conditions: Maintaining above $11,900.
- Targets: $124,533 (ATH) / $127,369 / $132,815.
- Potential: about 17% gain from current level.
Bearish scenario:
- Conditions: Break of support at $11,900.
- Targets: $107,555 / $105,200 / $100,000
- Potential: approximately -12% drop from current level.
Conclusion
Bitcoin is trading in a consolidation phase, where the strength of the underlying trend contrasts with short-term fragilities. The momentum remains broadly bullish, but the balance remains fragile, with sensitive zones that can quickly trigger marked movements. In this context, reactions to key technical thresholds and the macroeconomic climate will be decisive, especially as markets remain shaken by the notion that the Fed might not cut rates in September.