Shiba Inu recovery is likely if SHIB holds the $0.000011–$0.0000115 zone and reclaims $0.000012–$0.000014. Technical indicators show bearish bias now, but whale accumulation and liquidity clustered at $0.0000118 create a high-probability setup for a bounce.
-
Range-bound since February: $0.00001–$0.000016 with midpoint at $0.000013
-
Whale accumulation observed; Santiment reports ~1 trillion SHIB added to large-wallet cohorts.
-
Key on-chain and chart data: 12H RSI <50, H4 RSI 48.9, liquidity magnet at $0.0000118 (CoinGlass).
Meta description: Shiba Inu recovery: SHIB price shows whale accumulation and liquidity at $0.0000118; learn key levels, indicators, and buy signals. Read now.
What is the current technical outlook for Shiba Inu recovery?
Shiba Inu recovery remains conditional: the token is range-bound between $0.00001 and $0.000016, and technicals show short-term bearish bias. If SHIB holds $0.000011–$0.0000115 and buyers emerge, a move back toward $0.000012–$0.000014 becomes probable within weeks.
One of the most popular memecoins, Shiba Inu (SHIB), has lacked a sustained bullish trend in recent weeks. The broader altcoin market failed to make consistent gains through August, keeping SHIB confined to a multi-month range.
On-chain signals provide mixed evidence. Santiment-style data indicated large-wallet accumulation—roughly one trillion SHIB moved into the largest whale cohort—yet market structure and indicators remain neutral-to-bearish at the time of writing.


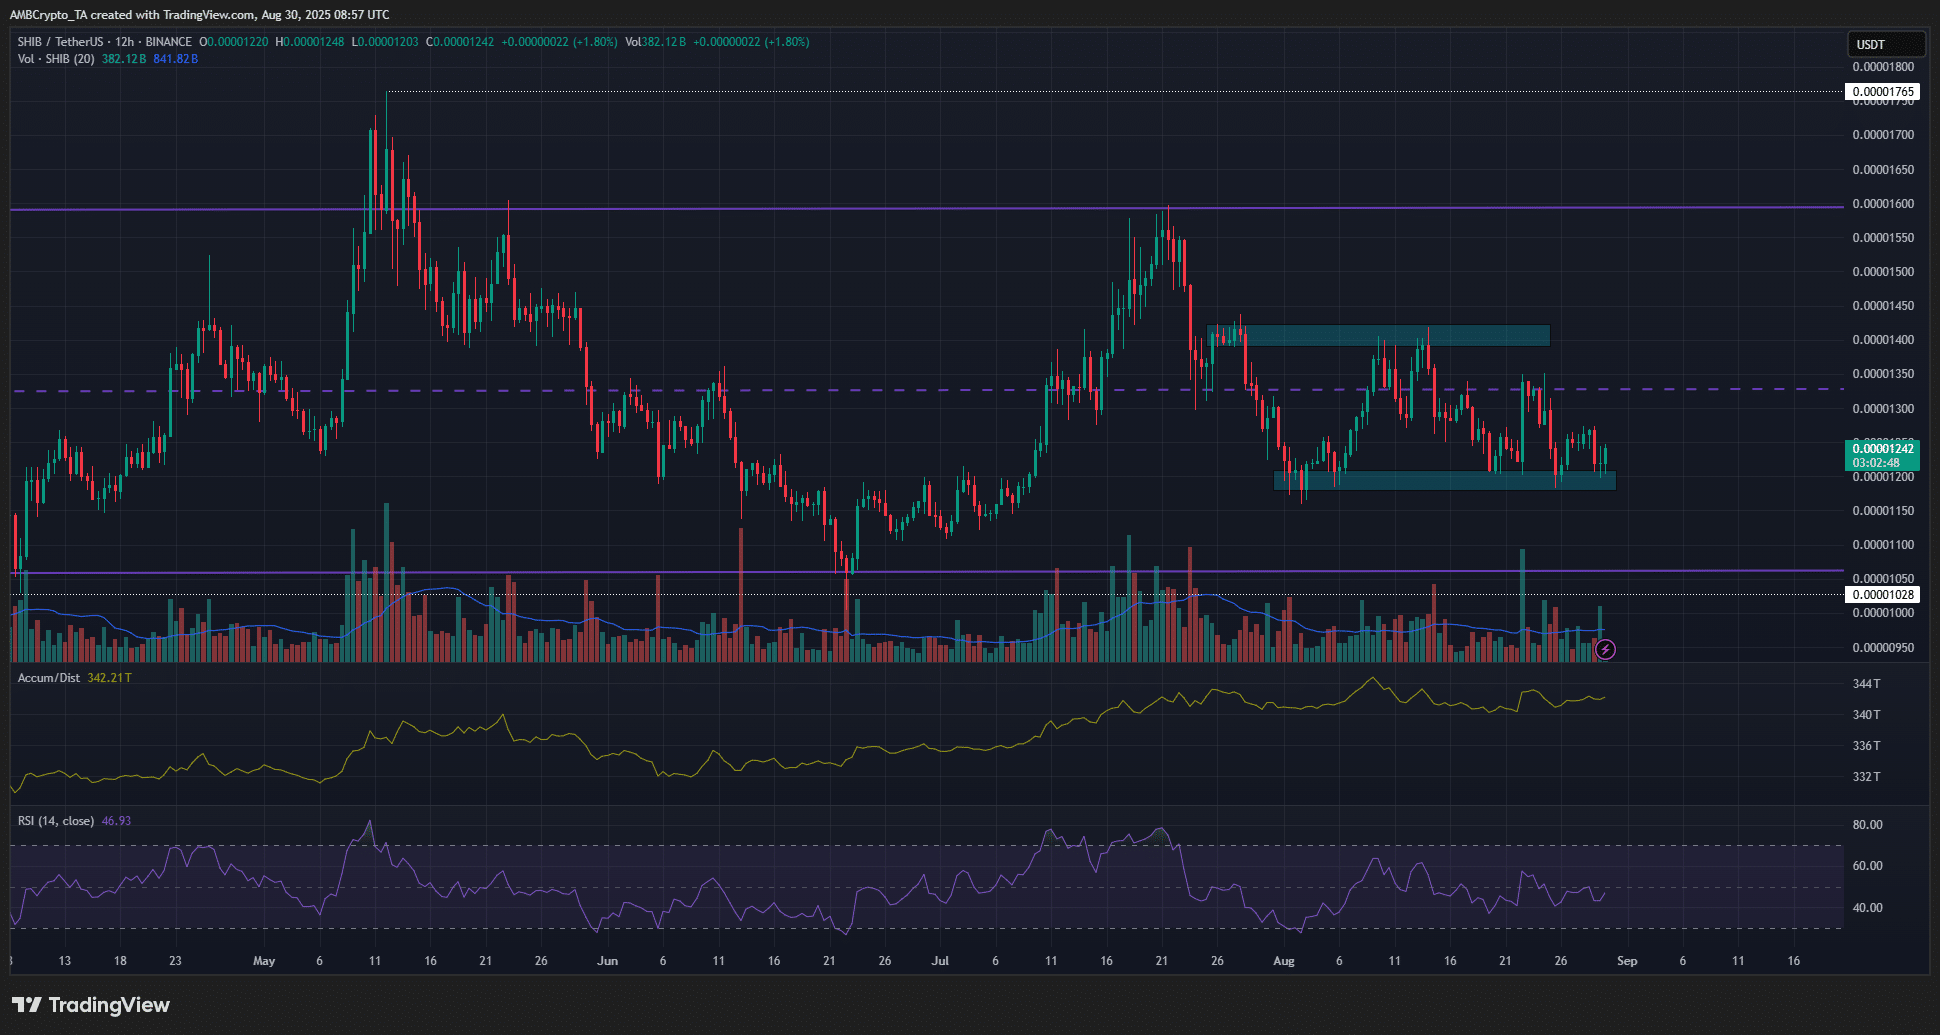
Source: SHIB/USDT on TradingView (price chart reference only)
Since February, the 12-hour chart highlighted a purple range from $0.00001 to $0.000016, with the midpoint at $0.000013. May’s breakout attempt failed and reversed, reinforcing range-bound dynamics. The 12H RSI sits below neutral 50, confirming limited bullish momentum.
How are whales and liquidity affecting SHIB price?
Whale accumulation and liquidity structure are central to recovery prospects. On-chain trackers (Santiment-style reporting) showed large-wallet groups adding roughly one trillion SHIB to their holdings recently.
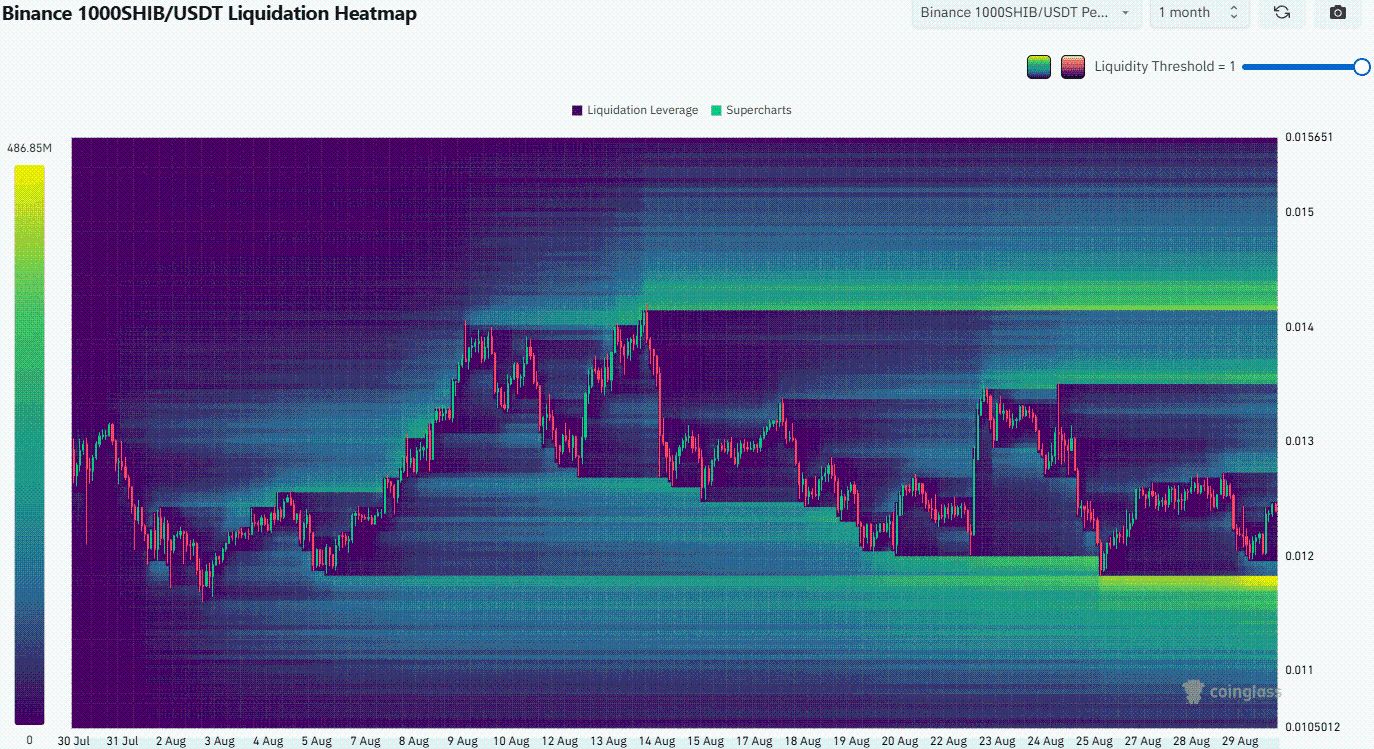
Liquidity analysis (CoinGlass-style heatmap) reveals a magnetic zone near $0.0000118. A sweep of that liquidity could trigger stop runs and then attract buyers, creating a potential reversal if demand outstrips selling pressure.
What do shorter timeframes indicate?
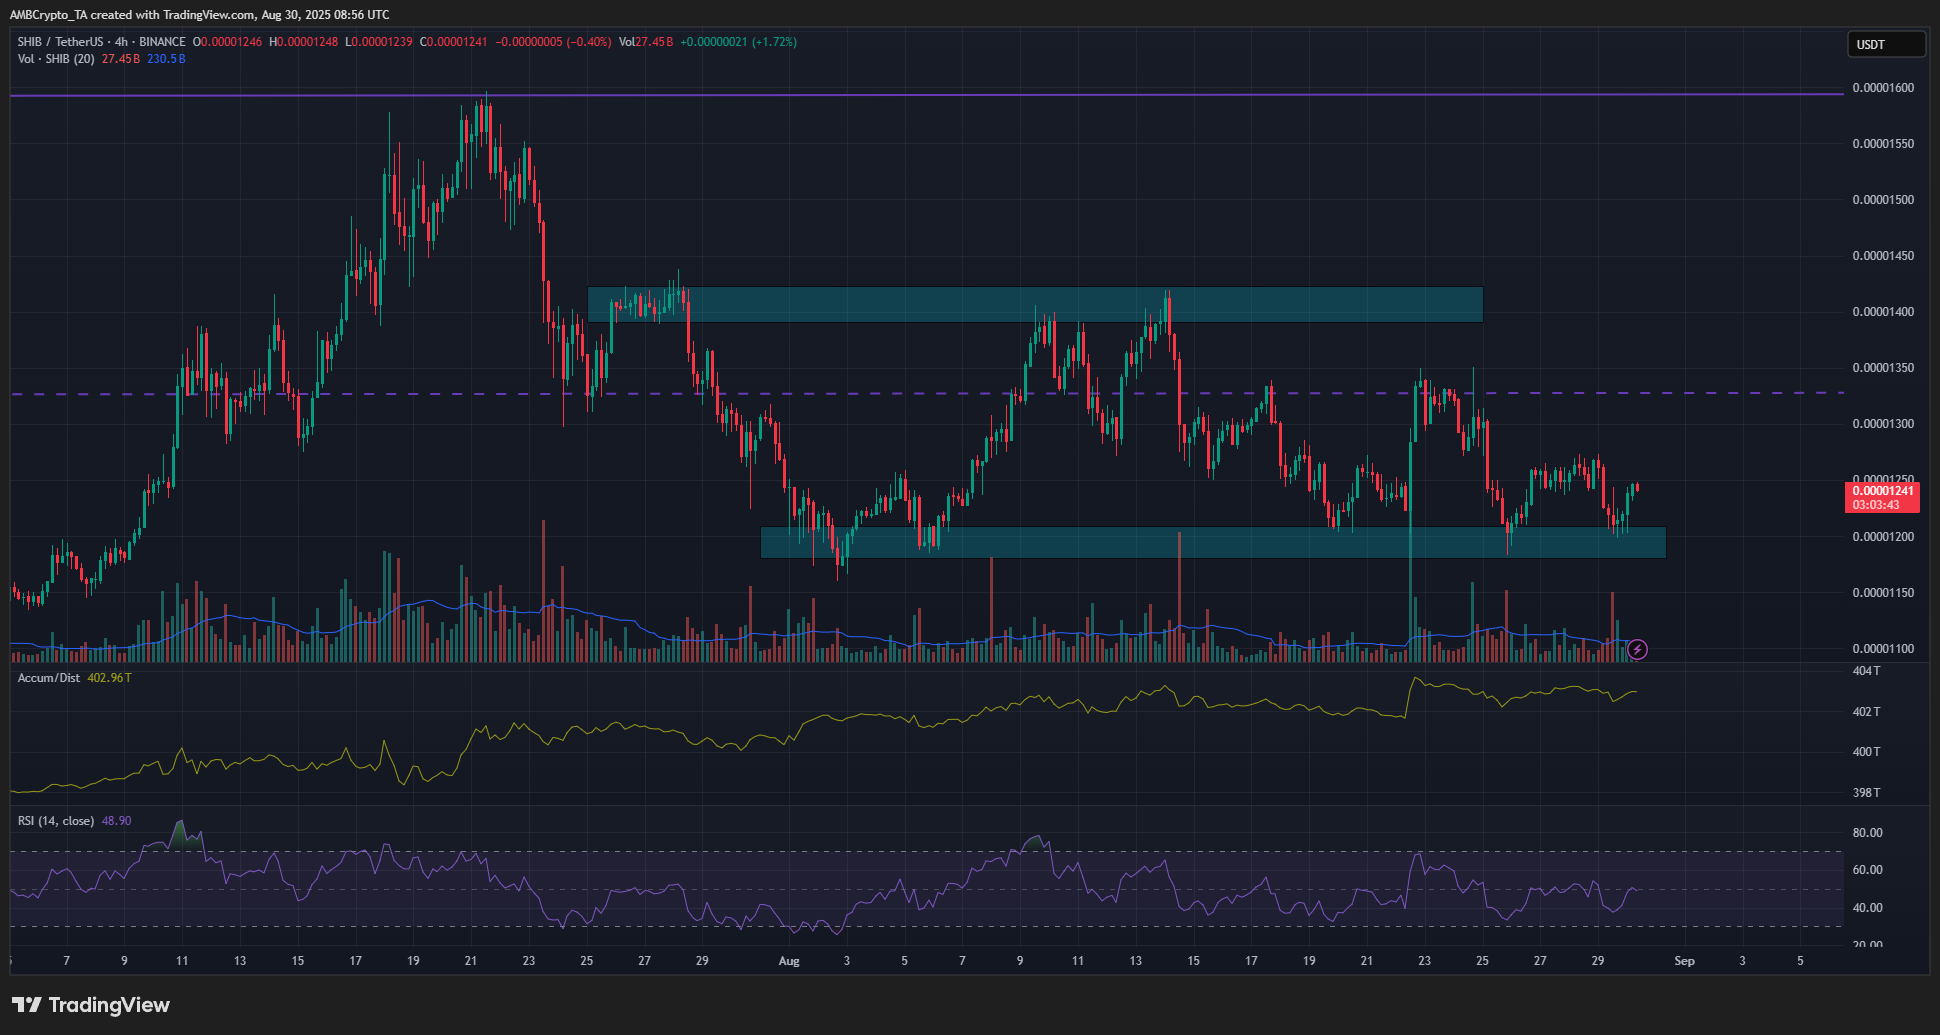
The 4-hour chart reveals two nearby technical bands at $0.000012 (support) and $0.000014 (resistance). H4 indicators are neutral: RSI ~48.9 and Accumulation/Distribution shows no clear trend. Price may dip toward $0.000011–$0.0000115 before a swing higher.


Source: SHIB/USDT on TradingView (short-term support/resistance reference)


Source: CoinGlass-style liquidation heatmap (liquidity clusters)
COINOTAG-style reporting and on-chain trackers were referenced for accumulation and liquidity context. COINOTAG analyst comment: “A sweep of $0.000011 liquidity followed by quick buying would be the technical event traders should watch for; it often precedes a short squeeze into the mid-range.” This reflects an evidence-based, non-speculative reading of chart and on-chain data.
Frequently Asked Questions
What price levels confirm a Shiba Inu bullish reversal?
Short-term confirmation begins with SHIB holding $0.000011–$0.0000115, reclaiming $0.000012, and getting RSI above 50 on 4H/12H frames. Break and hold above $0.000014 would strengthen a trend-change case.
How should traders use liquidity heatmaps for SHIB?
Use heatmaps to identify clustered stop zones and liquidity magnets—notable around $0.0000118. Plan entries after liquidity sweeps and confirm with volume and on-chain accumulation signals.
Key Takeaways
- Range-bound market: SHIB trades between $0.00001 and $0.000016; midpoint $0.000013 sets context for moves.
- On-chain accumulation: Large-wallet cohorts added ~1 trillion SHIB; accumulation often precedes run-ups.
- Actionable levels: Watch $0.000011–$0.0000115 for buys, $0.000012 for initial confirmation, $0.000014 to validate wider recovery.
Conclusion
Shiba Inu recovery is plausible but conditional. The market remains range-bound and technically weak, yet whale accumulation and concentrated liquidity at $0.0000118 create a favorable environment for a bounce if support holds. Monitor price action, on-chain flows, and momentum indicators; COINOTAG will update this analysis as new data emerges.