Bitget App
Trade smarter
Open
HomepageSign up
Bitget>
News>
Bonk (BONK) To Bounce Back? Key Harmonic Pattern Hints Potential Reversal

Bonk (BONK) To Bounce Back? Key Harmonic Pattern Hints Potential Reversal

CoinsProbe2025/08/30 22:35
By: Nilesh Hembade
SOL-2.99%BONK-3.81%ETH-2.97%

Date: Sat, Aug 30, 2025 | 05:30 AM GMT

The cryptocurrency market has once again entered choppy waters as Ethereum (ETH) slipped to $4,350 from its recent high of $4,954, marking a 7% weekly decline. The pullback has pressured major memecoins , including Solana-based Bonk (BONK).

However, BONK showed relative strength today with a 5% intraday jump, trimming its weekly losses to just 3%. More importantly, the price chart is signaling a harmonic pattern setup that could pave the way for a potential bounceback.

Bonk (BONK) To Bounce Back? Key Harmonic Pattern Hints Potential Reversal image 0 Source: Coinmarketcap

Harmonic Pattern Taking Shape

On the daily chart, BONK appears to be forming a Bearish ABCD harmonic pattern. Despite its bearish name, this pattern often involves a strong bullish CD-leg rally before the token approaches its Potential Reversal Zone (PRZ).

The structure kicked off with a rally from Point A near $0.00001142 up to Point B, followed by a retracement to Point C around $0.00001956, where buyers stepped in near the 200-day moving average (MA). Since then, BONK has shown resilience, climbing back to around $0.00002260, suggesting the CD leg may now be in motion.
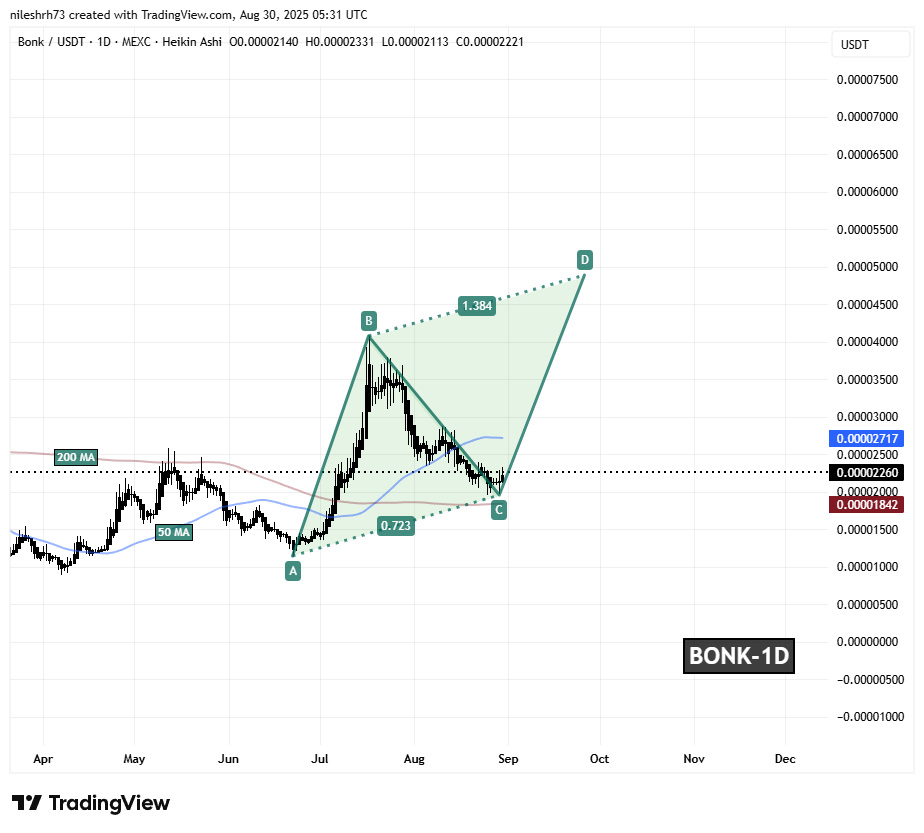
Bonk (BONK) To Bounce Back? Key Harmonic Pattern Hints Potential Reversal image 1 Bonk (BONK) Daily Chart/Coinsprobe (Source: Tradingview)

Critically, BONK is approaching its 50-day MA resistance at $0.00002717. A decisive breakout above this zone could validate the harmonic setup and trigger fresh momentum buying.

What’s Next for BONK?

If bulls manage to push BONK above the 50-day MA, the token could rally toward the 1.38 Fibonacci PRZ at $0.00004890, implying a potential upside of over 116% from current levels.

On the flip side, if BONK loses ground and closes below the 200-day MA support near $0.00001842, the harmonic structure could be invalidated, opening the door to further downside pressure.

Disclaimer: The content of this article solely reflects the author's opinion and does not represent the platform in any capacity. This article is not intended to serve as a reference for making investment decisions.
PoolX: Earn new token airdrops
Lock your assets and earn 10%+ APR
Lock now!

You may also like

Trade War + AI Bubble: When Two Major "Powder Kegs" Converge, Is the Endgame of the Supercycle Already Decided?

The global economy faces risks from feedback loops among policy, leverage, and confidence. Technology supports growth, but fiscal populism is on the rise and trust in currency is gradually eroding. Trade protectionism and speculative AI-driven finance are intensifying market volatility. Summary generated by Mars AI. The accuracy and completeness of this summary are still being iteratively improved.

MarsBit2025/10/21 04:28

Trending news

More
1
Trade War + AI Bubble: When Two Major "Powder Kegs" Converge, Is the Endgame of the Supercycle Already Decided?
2
Vitalik praised Sandeep and Polygon for their contributions to the Ethereum ecosystem.

Crypto prices

More
Bitcoin
Bitcoin
BTC
$108,024.7
-2.08%
Ethereum
Ethereum
ETH
$3,867.39
-4.37%
Tether USDt
Tether USDt
USDT
$1
-0.04%
BNB
BNB
BNB
$1,074.24
-4.63%
XRP
XRP
XRP
$2.44
+0.06%
Solana
Solana
SOL
$184.26
-3.67%
USDC
USDC
USDC
$1
+0.02%
TRON
TRON
TRX
$0.3197
-0.46%
Dogecoin
Dogecoin
DOGE
$0.1943
-2.95%
Cardano
Cardano
ADA
$0.6462
-2.47%
How to sell PI
Bitget lists PI – Buy or sell PI quickly on Bitget!
Trade now
Become a trader now?A welcome pack worth 6200 USDT for new users!
Sign up now
Trade smarter