XRP price is showing an undervaluation signal from the Bollinger Bands: the daily price trades at $2.83 below the 20-day midline ($2.91) while holding above the lower band ($2.70), implying potential upside toward weekly and monthly upper bands near $3.46–$3.51.
-
Daily: $2.83 vs 20-day mid $2.91 — price below midline but above lower band ($2.70)
-
Weekly band upper at $3.46 offers ~20% room before the model flags overextension.
-
Monthly perspective keeps XRP in a long-term “discount zone” with monthly upper at $3.51.
XRP price showing Bollinger Bands undervaluation at $2.83 — read the weekly & monthly outlook, key levels, and trade insights. View full analysis now.
What is the XRP price signal from Bollinger Bands?
The XRP price is registering an undervaluation signal on Bollinger Bands as the daily close (~$2.83) sits below the 20-day midpoint ($2.91) while remaining above the lower band ($2.70). This setup indicates relative weakness versus the short-term average but leaves clear upside room before the bands deem the market expensive.
The Bollinger Bands reading is consistent across multiple timeframes, which strengthens the signal without relying on a single-period snapshot.
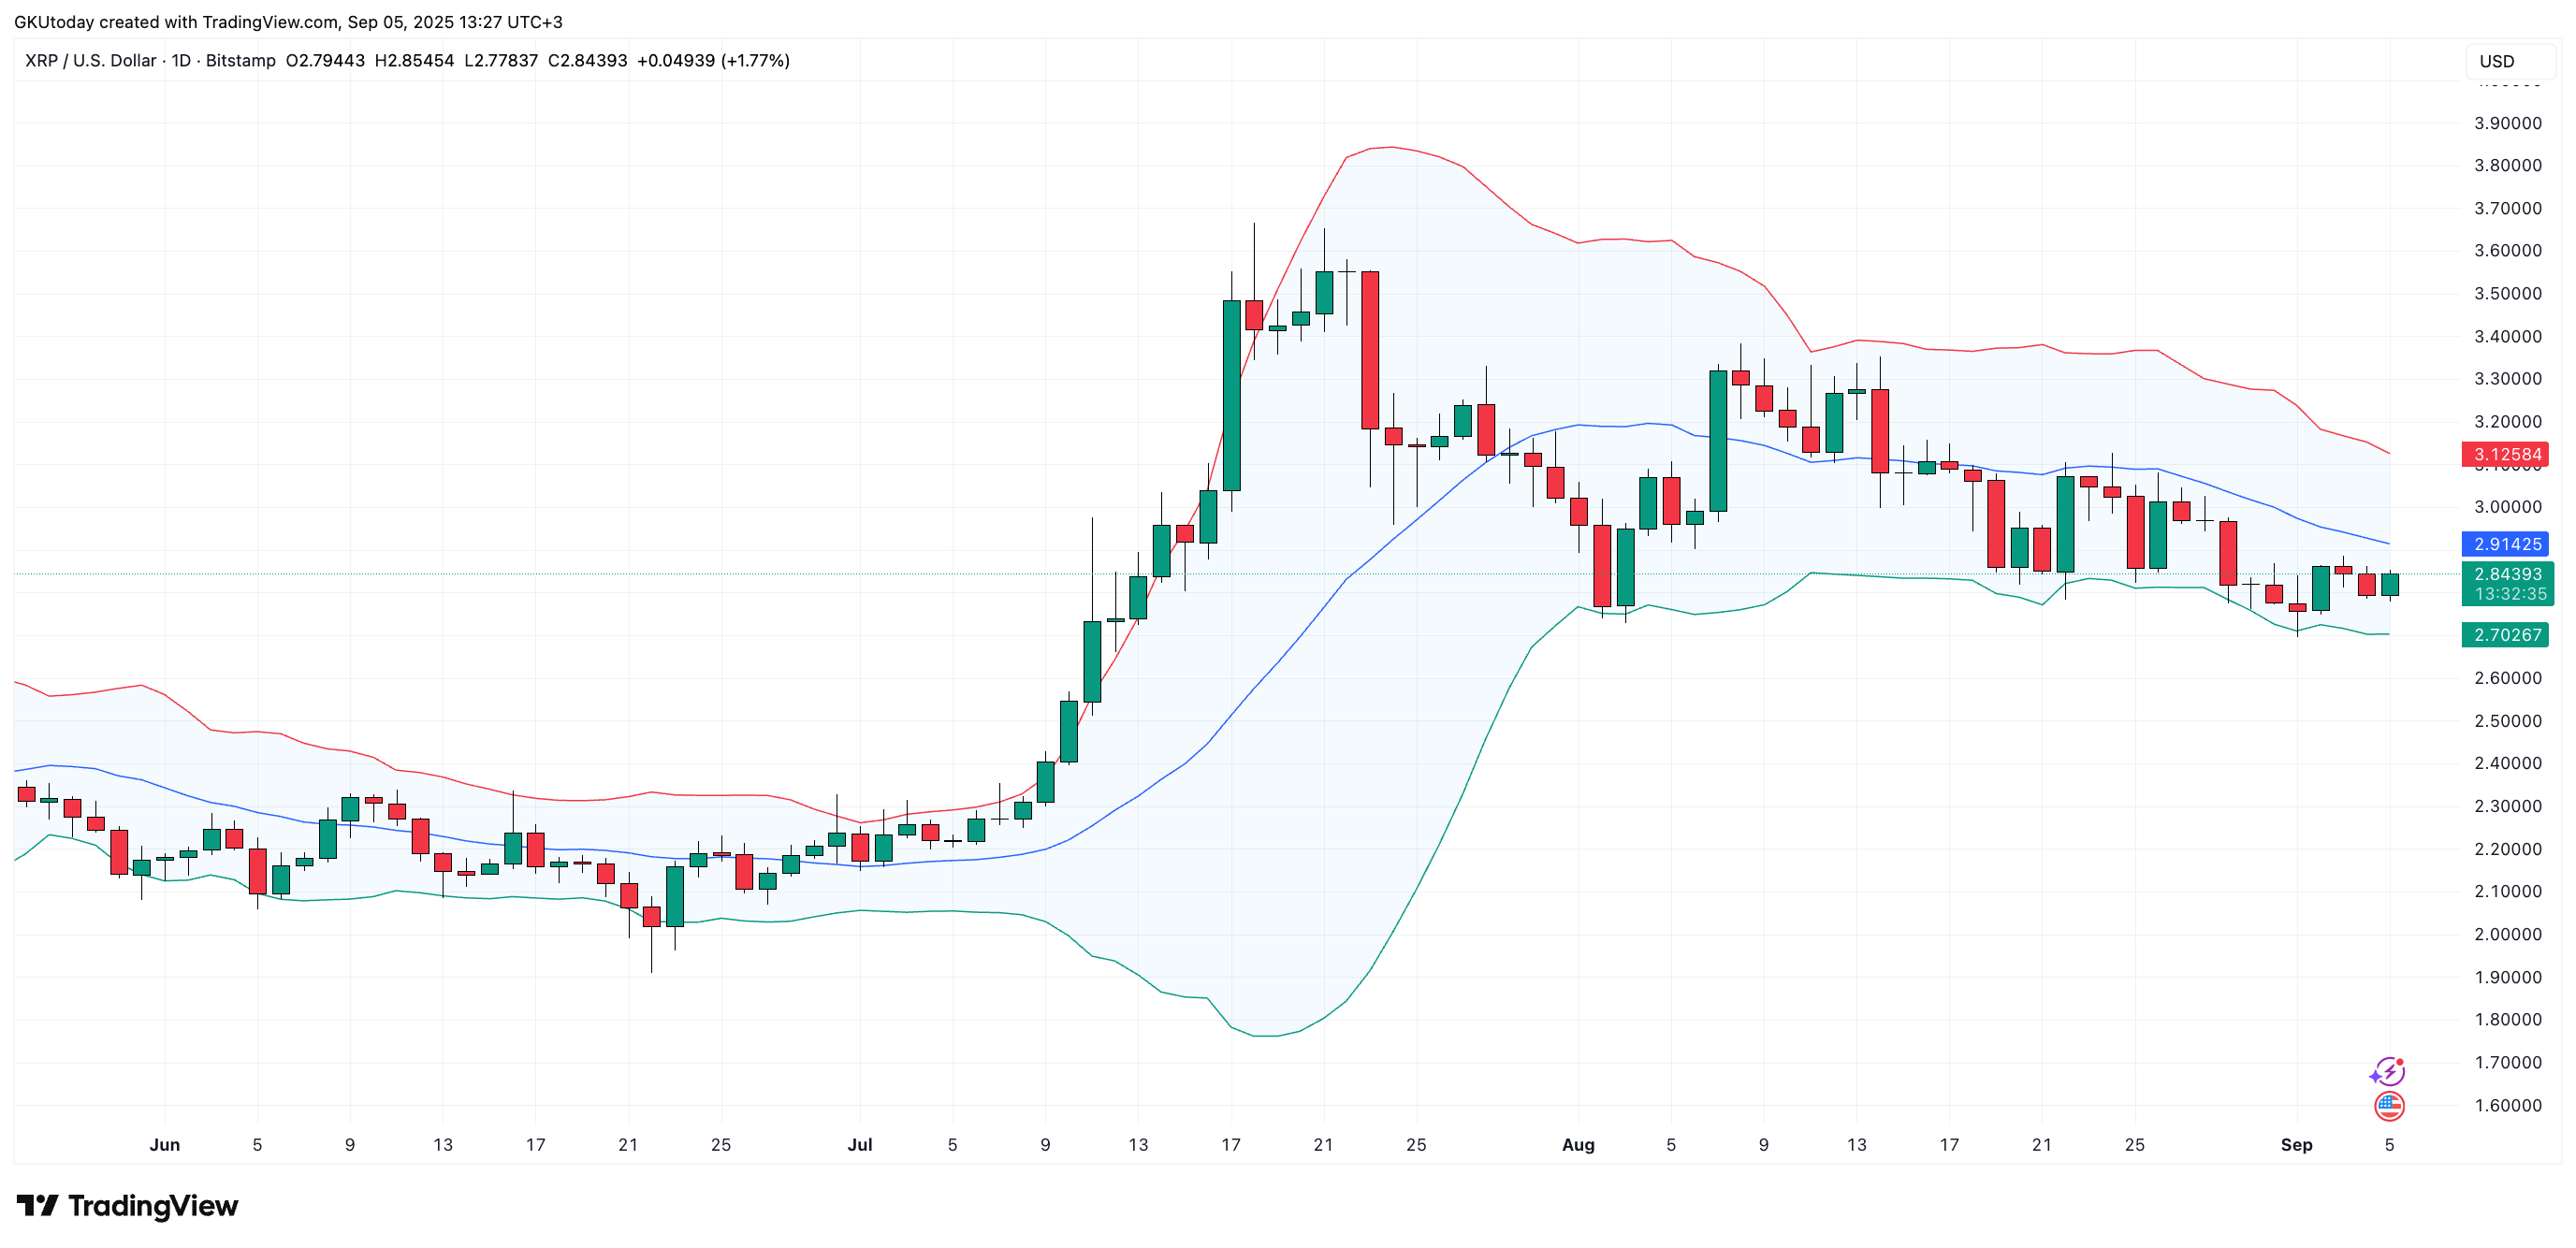
Source: TradingView
How does the daily Bollinger Bands reading affect short-term outlook?
On the daily chart, the Bollinger Bands midpoint (20-day SMA) at $2.91 marks the short-term fair value. With price at $2.83, traders see the token priced below average but not in panic territory because the lower band is holding at $2.70.
This structure suggests two practical scenarios for short-term traders: (1) mean-reversion toward the midline if momentum returns, or (2) consolidation above the lower band if selling pressure remains limited. Volume confirmation and candlestick patterns should be used to refine entries.
Why do weekly and monthly frames matter for XRP price?
Weekly and monthly Bollinger Bands provide context for the magnitude of potential moves. The weekly upper band near $3.46 gives nearly 20% room from current levels before the band marks overextension. The monthly upper near $3.51 reinforces a broader-cycle ceiling, indicating the current range still sits in the discount zone of the ongoing cycle.
Longer timeframes reduce noise and help investors avoid false breakouts that appear on daily charts.
XRP price: Weekly outlook
XRP remains above the weekly median (~$2.60) and beneath the weekly upper band at $3.46. That means a potential 18–20% run is possible within the band structure before the model labels the move as stretched.
Weekly momentum and macro liquidity will determine whether price tests the upper band or simply drifts inside the band range.
How should traders interpret monthly signals?
The monthly chart shows XRP holding near long-term ranges since early 2025, with a monthly reference level around $1.57 and a monthly upper band at $3.51. Historically, when XRP revisits that monthly base it can spend extended periods in the upper half of the band, which supports a constructive medium-term view.
Comparative band levels
| Daily | $2.70 | $2.91 | $3.46 (weekly upper shown for reference) | ~22% (to $3.46) |
| Weekly | $2.60 (median) | $2.91 | $3.46 | ~22% |
| Monthly | $1.57 (long-term base) | $2.91 | $3.51 | ~24% |
Frequently Asked Questions
Is XRP price undervalued based on Bollinger Bands?
Yes. The XRP price (~$2.83) is below the 20-day midline ($2.91) and above the lower band ($2.70), a pattern typically interpreted as undervaluation within the Bollinger Bands framework until the lower band breaks decisively.
How far can XRP rise before Bollinger Bands indicate overextension?
Based on the weekly and monthly bands, XRP could rise roughly 18–24% toward the upper bands ($3.46–$3.51) before those models consider the asset overextended.
What confirms a shift from undervaluation to a breakout?
Confirmation includes sustained closes above the 20-day midline, increased volume, and continuation into or above the upper band. Divergence with momentum indicators strengthens conviction.
Key Takeaways
- Current signal: XRP price shows undervaluation on daily Bollinger Bands while holding above the lower band.
- Timeframe alignment: Weekly and monthly bands corroborate the discount-zone view and project ~18–24% upside to upper bands.
- Risk management: Use band edges and the 20-day midline as trade management levels; watch volume for confirmation.
Conclusion
This analysis shows the XRP price trading inside a multi-timeframe Bollinger Bands discount zone, with daily weakness but clear upside before bands mark overextension. Traders should combine band context with volume, candlestick validation, and risk controls. COINOTAG will continue to monitor band shifts and on-chain signals for updates.