Bitcoin price is trading near $112,800 after a short-term breakout and consolidation; BTC appears set to test $113,000–$116,000 if daily closes hold above $112,775, while sideways action between $111,000–$115,000 remains likely as buyers accumulate.
-
BTC short-term breakout: false breakout at $112,775 with potential continuation to $113,000.
-
Midterm resistance range sits at $113,473 to $116,000; sideways consolidation likely if momentum stalls.
-
Data from CoinStats and charting via TradingView show BTC trading at $112,831 at press time.
Bitcoin price update: BTC trading near $112,831 after a false breakout; watch daily closes above $112,775 for a move toward $113,000–$116,000. Read on for levels and analysis.
What is the current Bitcoin price outlook?
Bitcoin price is trading around $112,831 and has shown a short-term false breakout at $112,775 on the hourly chart. If daily candles close above $112,775, the market may push toward $113,000 and test resistance up to $116,000; otherwise, expect range-bound action near $111,000–$115,000.
The crypto market is in the green zone again, according to CoinStats.
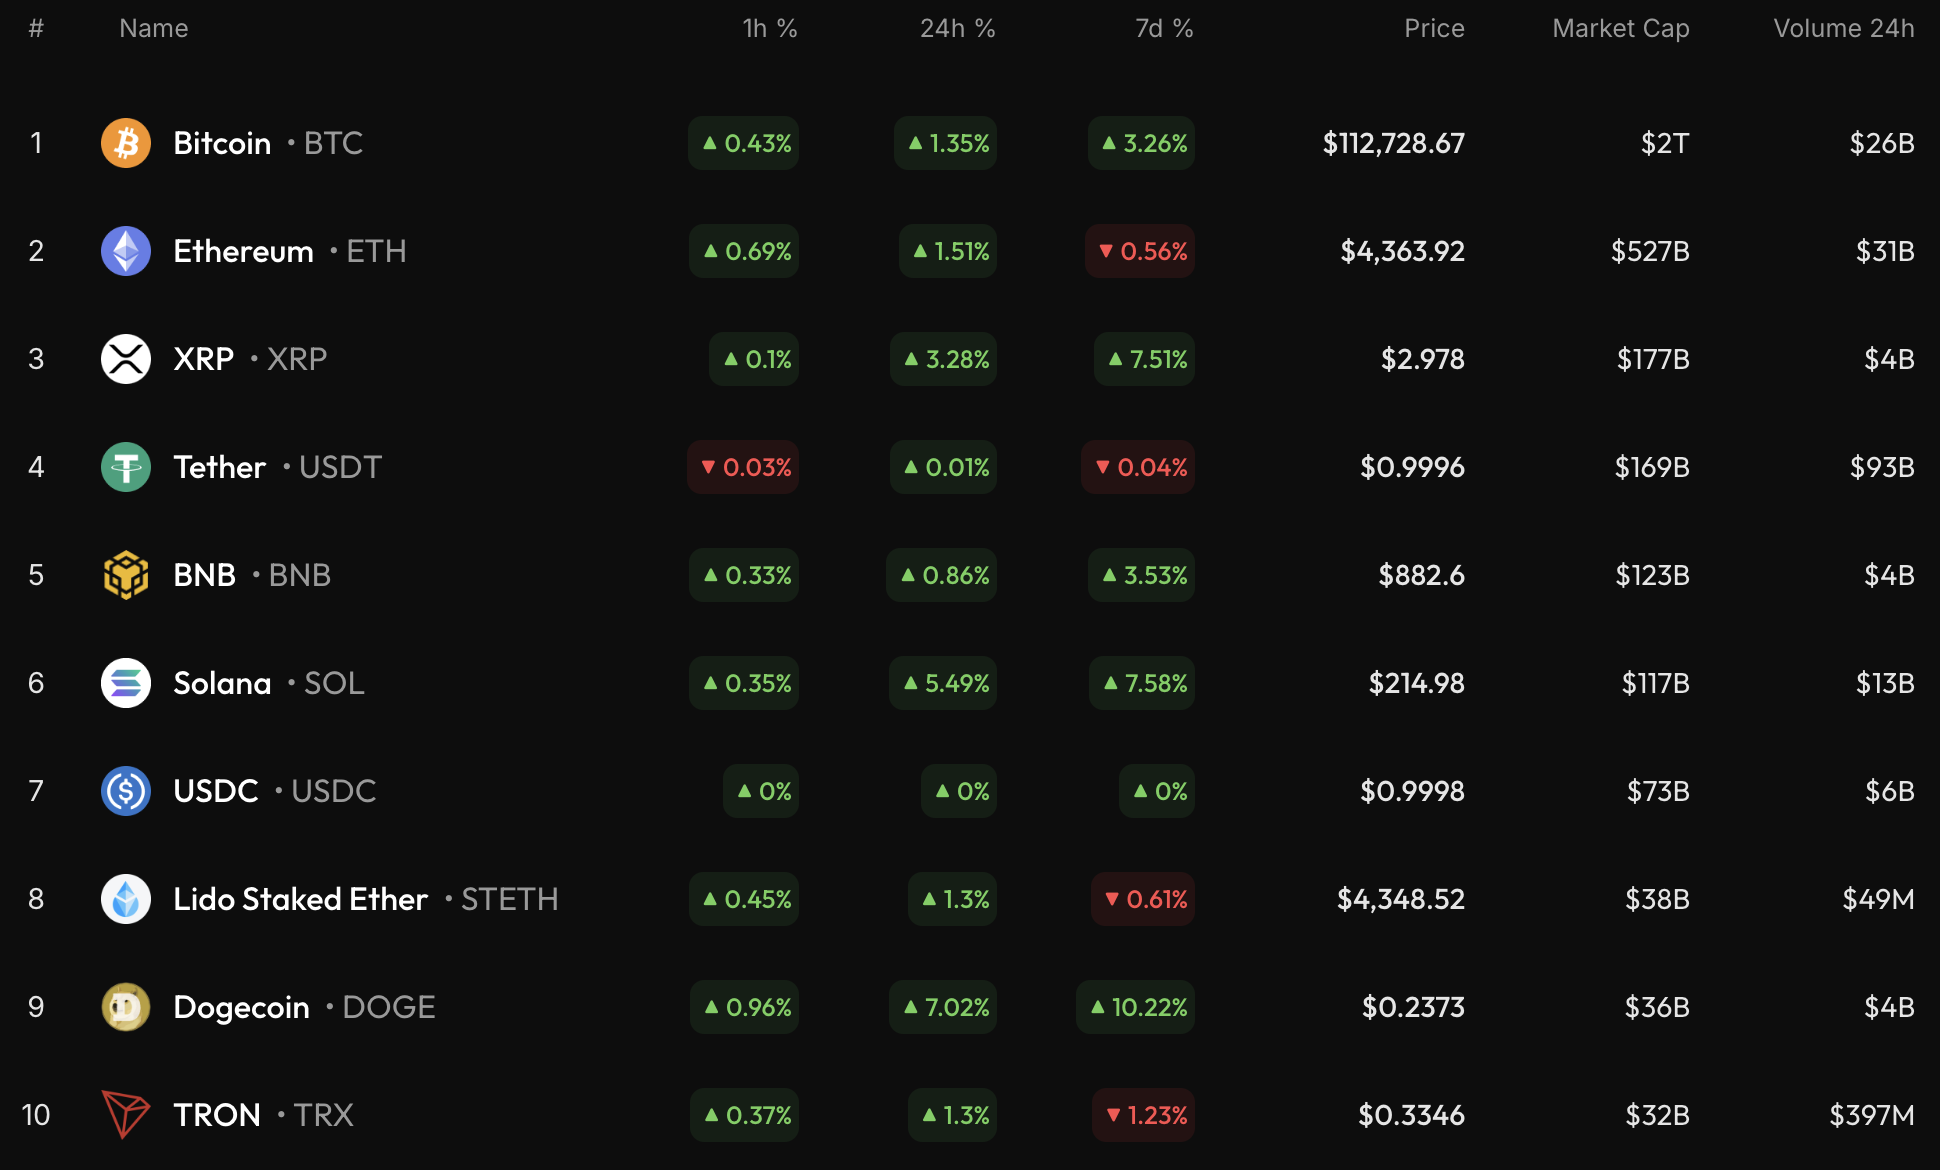
Top coins by CoinStats
How did BTC reach the $112,800 area?
Short-term momentum lifted BTC after a sequence of higher intraday lows and a test of local resistance. The hourly chart shows a false breakout of $112,775, then a quick retracement. TradingView chart patterns indicate buyers remain active but need sustained daily closes to confirm continuation.
What technical levels should traders watch?
Key levels:
- Support: $107,389 (recent false-breakout base) and $111,000 (range support).
- Immediate resistance: $112,775 – daily close here is decisive.
- Target resistance zone: $113,000–$116,000, with $113,473 noted on longer time frames.
On the hourly chart, the rate of BTC has made a false breakout of the local resistance of $112,775.
However, if the daily bar closes around that mark or above it, the upward move may continue to the $113,000 range by tomorrow.
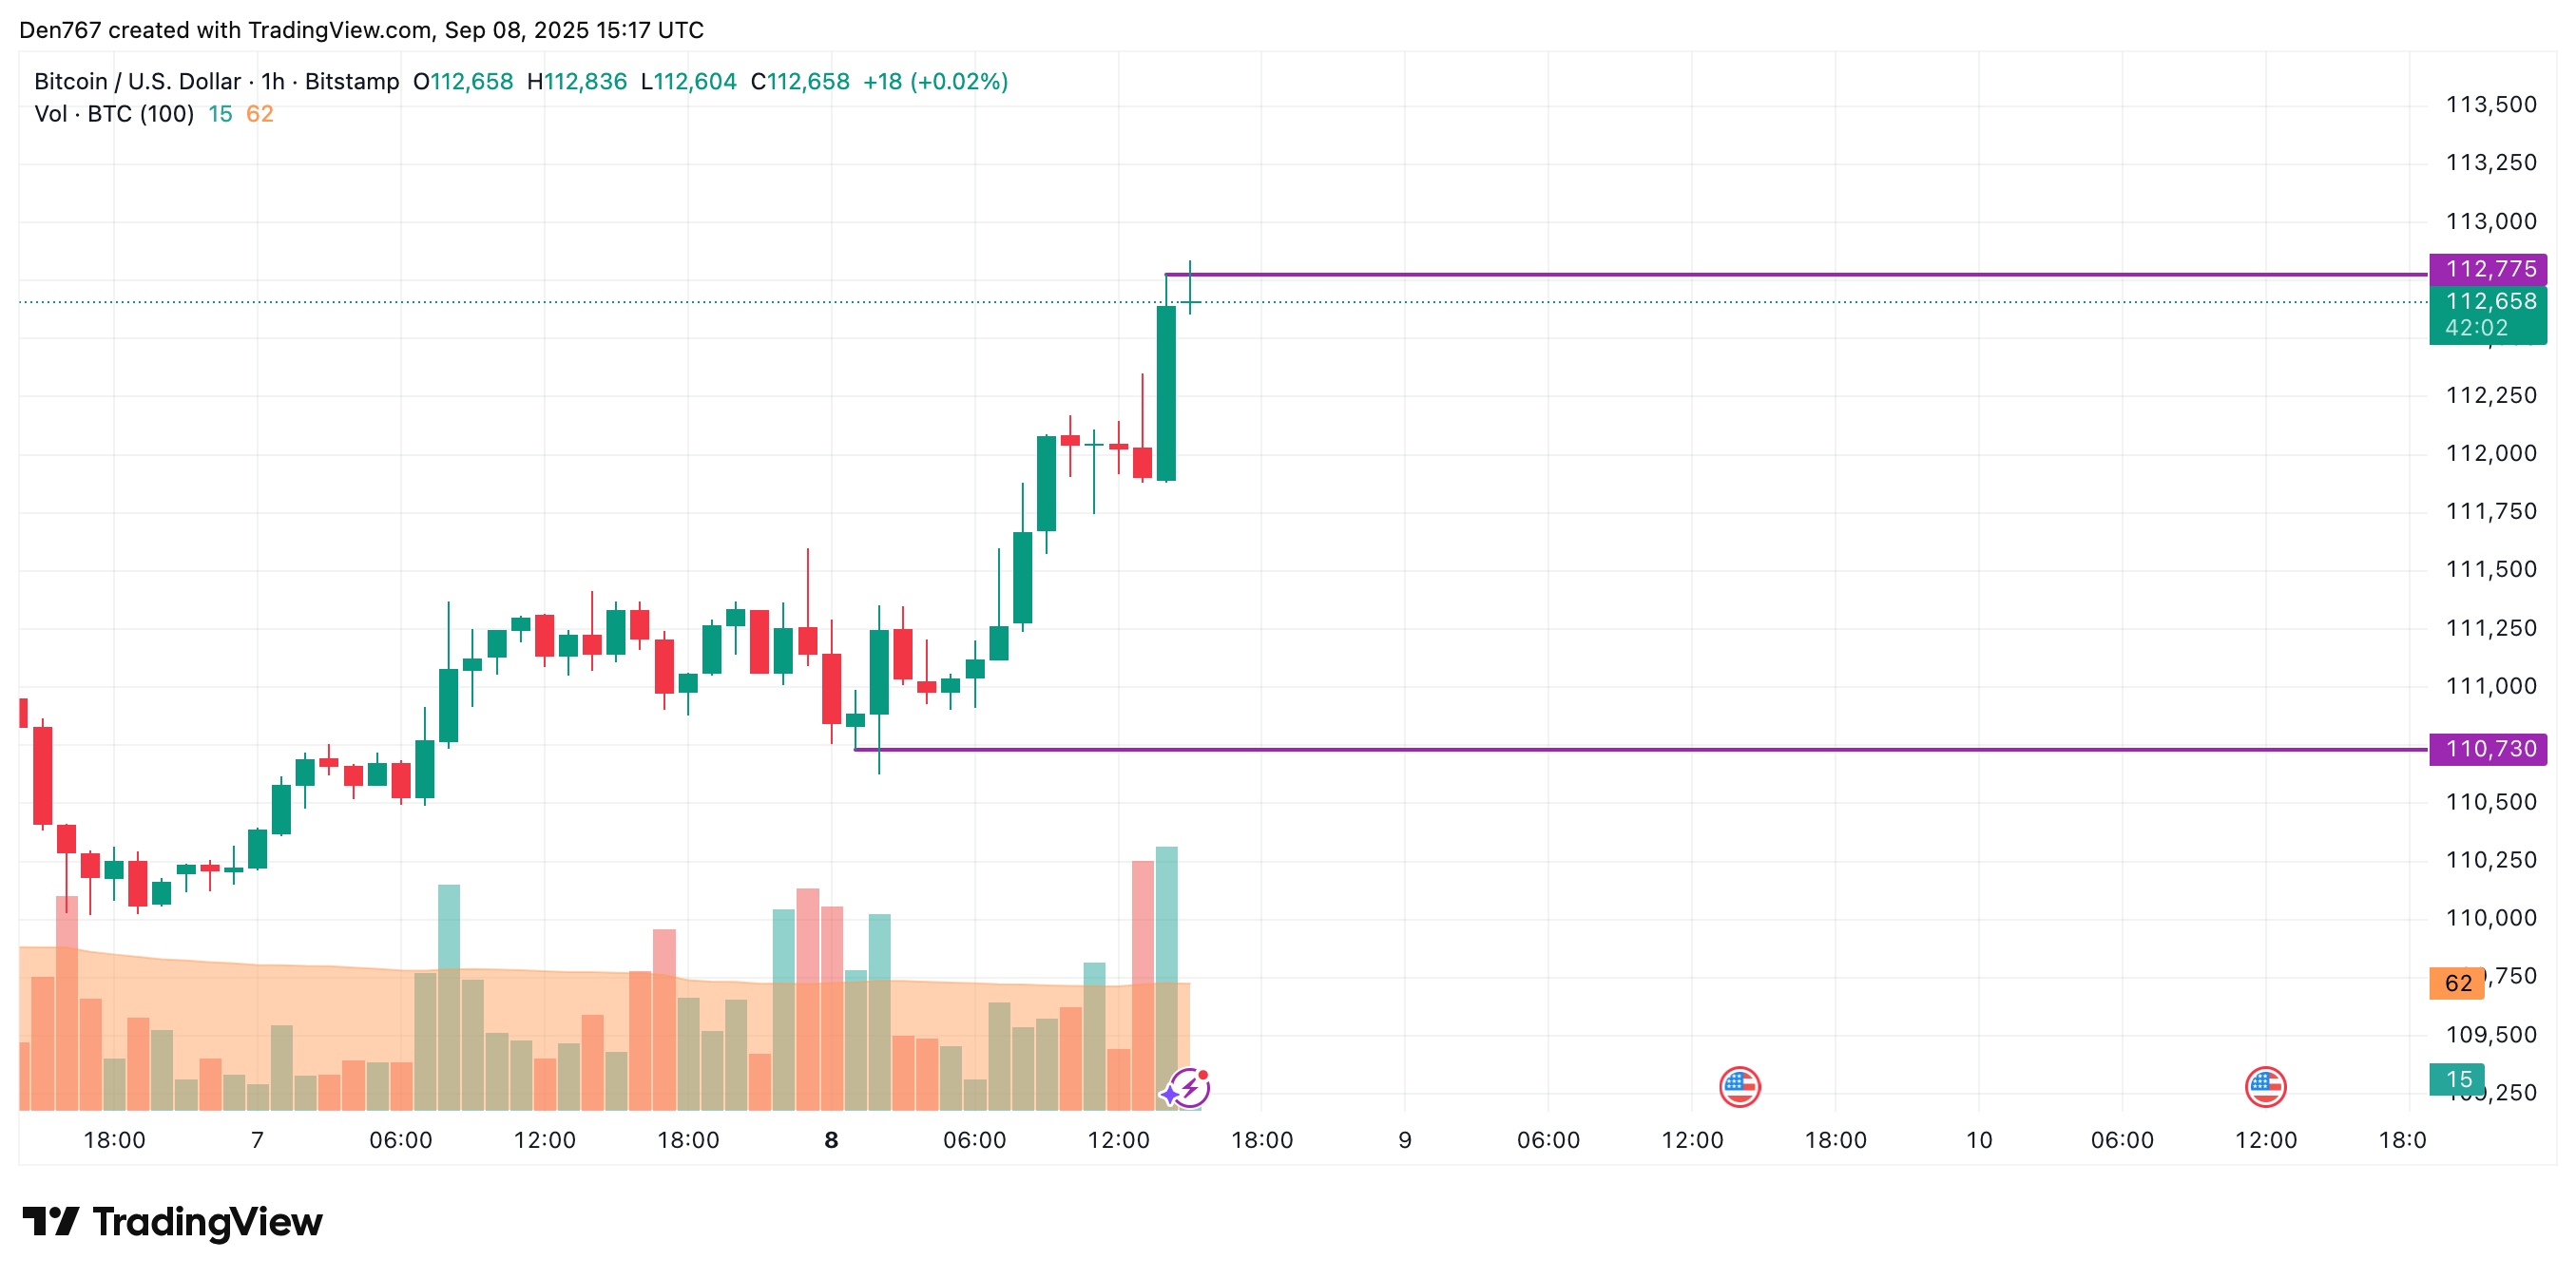
Image by TradingView
On the longer time frame, the price of the main crypto is on its way to the resistance of $113,473. If bulls’ pressure continues, there is a chance to witness a test of the $113,000-$116,000 area soon.
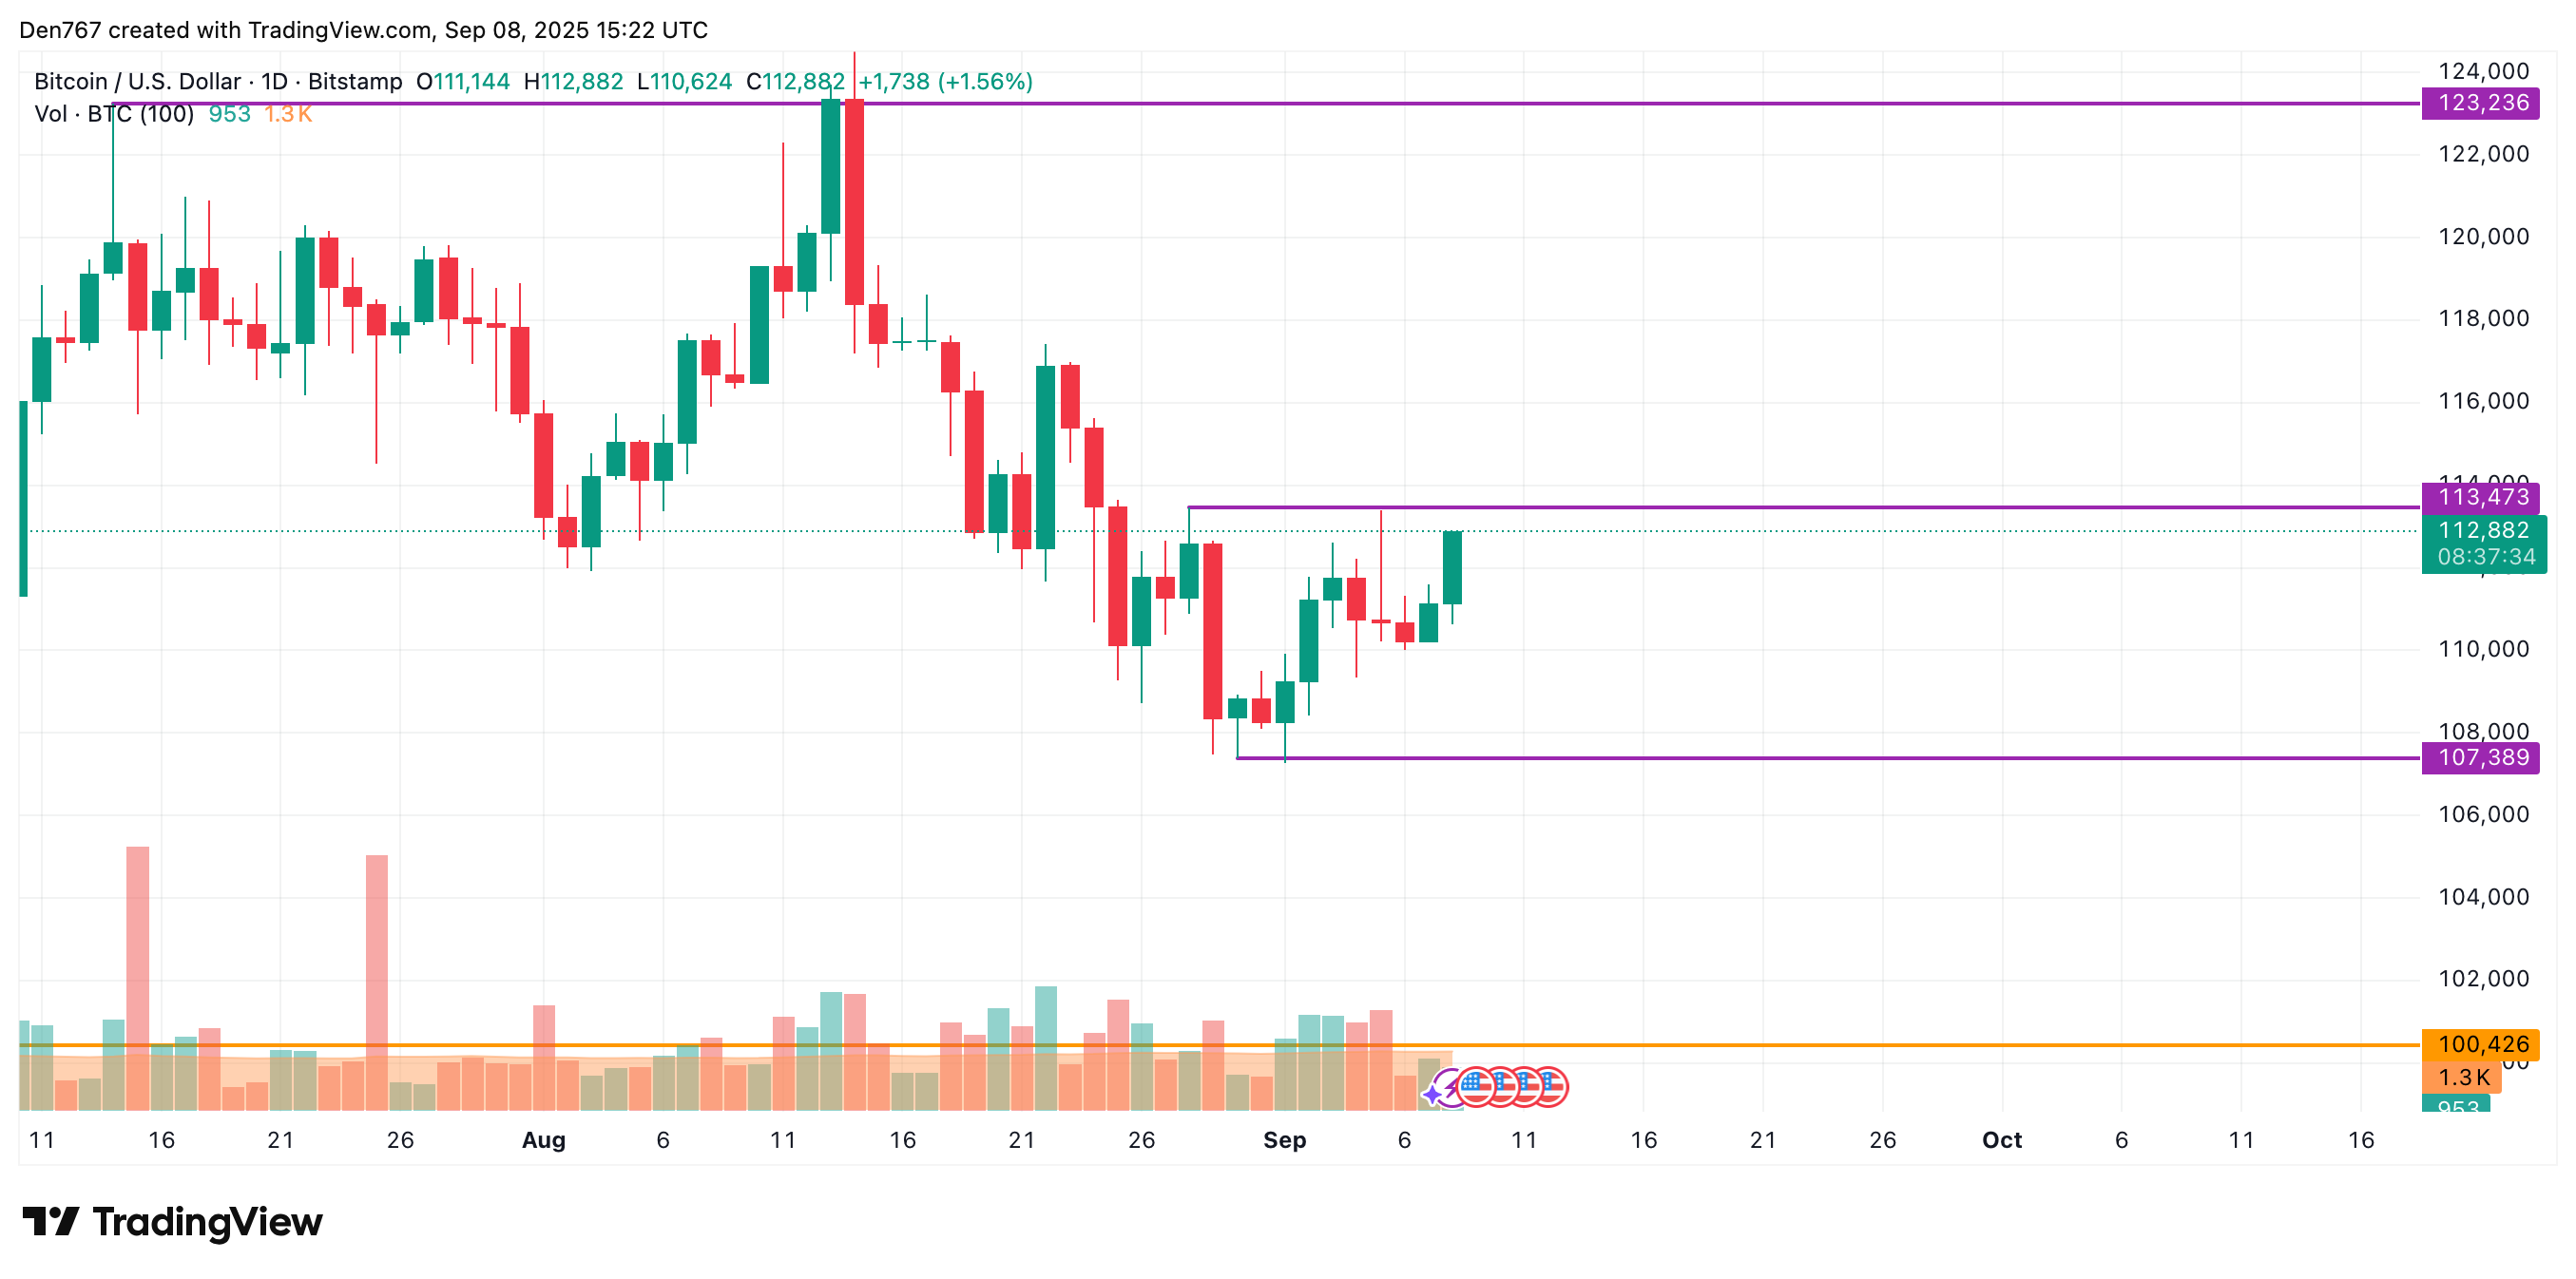
Image by TradingView
From the midterm point of view, the rate of BTC is rising after a false breakout of the $107,389 level. However, buyers might need more time to accumulate energy for a further move. In this case, sideways trading in the area of $111,000-$115,000 is the most likely scenario.
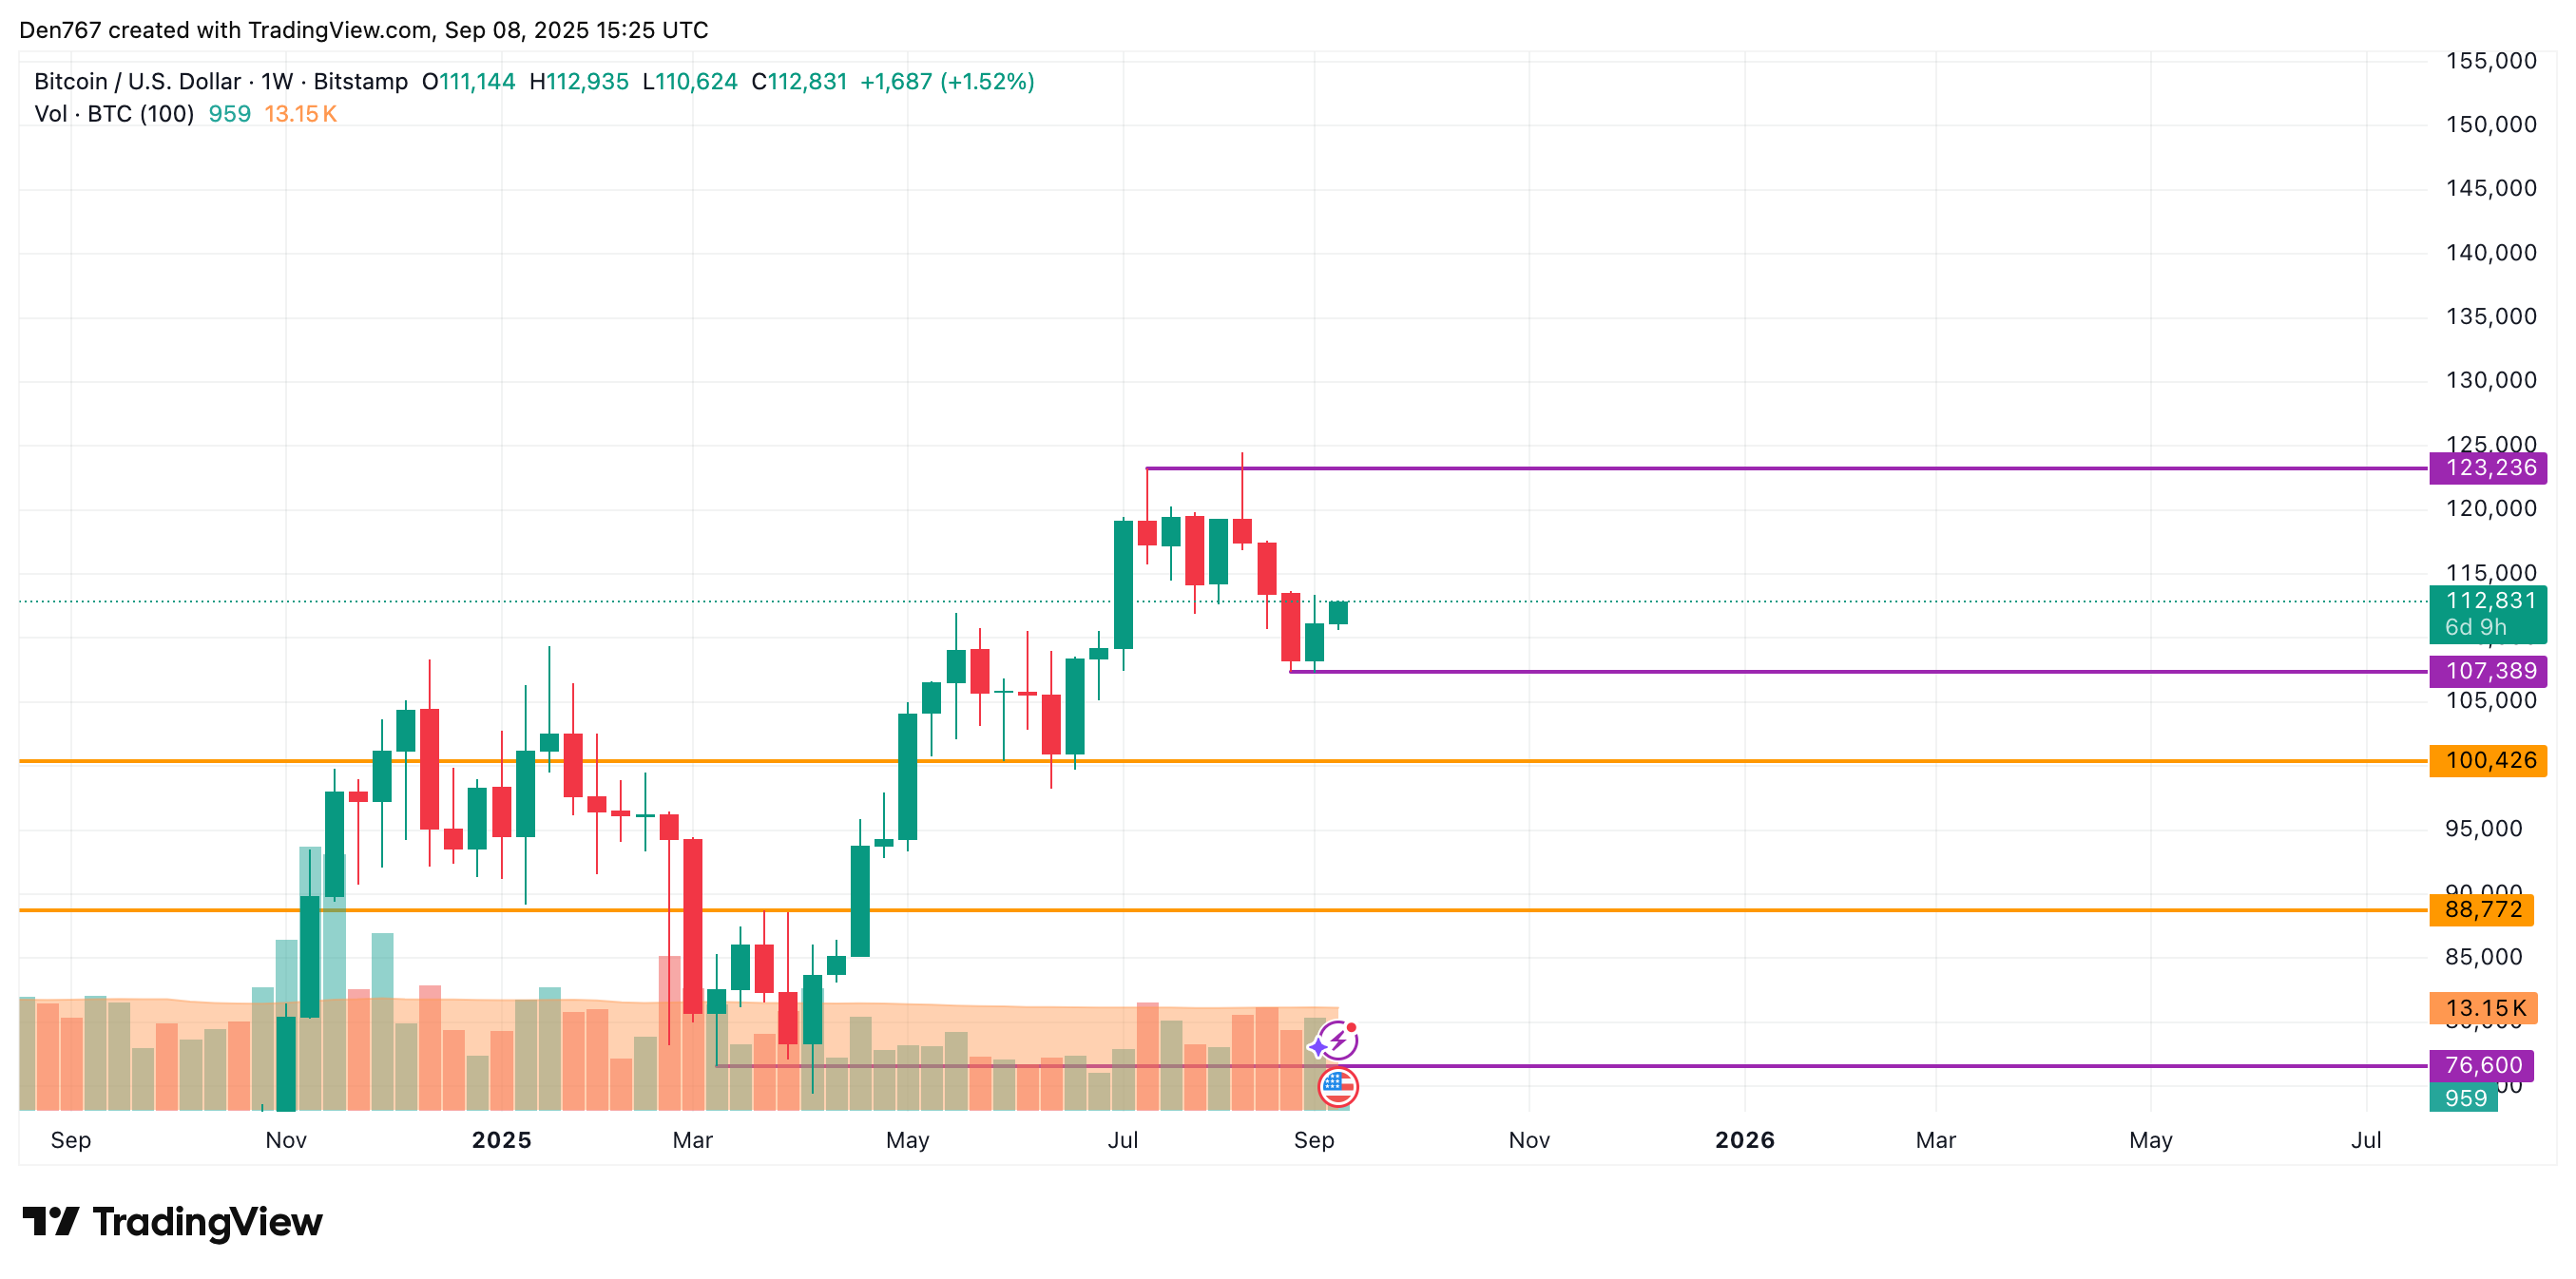
Image by TradingView
BTC price is trading at $112,831 at press time.
Why does the market favor consolidation now?
Liquidity and trader positioning commonly cause short consolidation after a breakout attempt. Market participants often wait for confirmation via daily closes. On-chain flows (reported by CoinStats) and chart structure on TradingView show accumulation rather than decisive distribution.
Frequently Asked Questions
Will Bitcoin break above $113,000 today?
It depends on whether the daily candle closes above $112,775. A confirmed close above that level raises the probability of a move to $113,000; without confirmation, expect a return to the $111,000–$115,000 range within 24–48 hours.
How high can BTC go if $113,000 is cleared?
If bulls sustain momentum after a confirmed breakout, the next resistance area to watch is $113,473 to $116,000, based on longer time-frame resistance zones observed on multiple charts.
What should spot traders do now?
Traders should: 1) Wait for a daily close above $112,775 to add directional exposure. 2) Use tight risk management around $111,000. 3) Monitor volume and on-chain indicators reported by CoinStats for confirmation.
Key Takeaways
- Short-term breakout: False breakout at $112,775 — daily close is decisive.
- Range bias: Likely sideways action between $111,000 and $115,000 if momentum stalls.
- Targets: Confirmed continuation could test $113,000–$116,000; monitor CoinStats and TradingView indicators.
Conclusion
This market update shows the Bitcoin price consolidating near $112,831 after an intraday false breakout. Traders should prioritize daily-close confirmation and manage risk around $111,000 while watching resistance up to $116,000. For ongoing coverage and level updates, follow COINOTAG reports and chart updates.