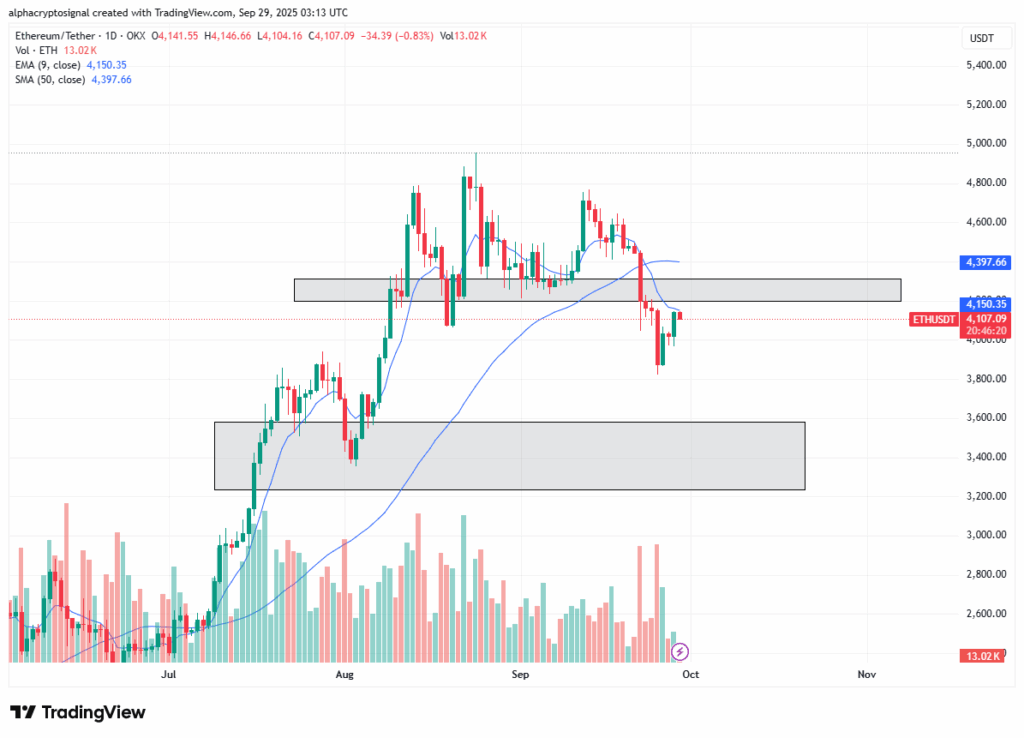
Ethereum resistance at $4,150 is capping upside as short-term moving averages and a $4,400 supply zone create selling pressure. Futures volume and a near 2% rise in open interest show trader buildup, keeping ETH range-bound between $3,400–$4,400 until bulls close decisively above the 9-day EMA.
-
ETH failing to close above 9-day EMA near $4,150 signals limited upside and risk of re-test to $3,400–$3,600.
-
Futures volume jumped ~39% to $198B with open interest +1.91%, indicating position accumulation ahead of a big move.
-
Historical Q4 strength after mixed Q3s raises odds of year-end rallies; ETH is +64% over 90 days, +23% YTD.
Ethereum resistance at $4,150 stalls upside — ETH price outlook, futures signals, and Q4 scenarios explained. Read updated analysis and key levels. (Updated Oct 2025)
Ethereum struggles at $4,150 resistance as bulls fight to hold momentum amid growing selling pressure.
- ETH faces strong rejection near $4,400, with moving averages now acting as resistance.
- Open interest jumps 1.91% amid rising volume, signaling trader buildup near $4K.
- Historical Q4 rallies follow stabilizing Q3s, raising expectations for another bullish run.
Ethereum is stuck just below $4,150 resistance after losing support earlier this month. With mixed futures activity and weak momentum, traders are watching closely—will ETH break higher or fall back toward stronger support near $3,400–$3,600?
What is causing Ethereum resistance near $4,150?
Ethereum resistance near $4,150 is driven by short-term moving averages (9-day EMA, 50-day SMA) sitting above price and a layered supply zone around $4,400 where late buyers are exiting. These technical barriers, combined with mixed futures positioning, keep upward momentum muted until a confirmed close above key EMAs.
How does futures open interest and volume influence ETH price action?
Open interest rose ~1.91% while futures volume spiked ~39% to roughly $198 billion in a day, indicating fresh positioning. High volume with rising open interest usually signals conviction; here it suggests traders are betting on a directional move but remain split, as longs and shorts are near parity. This creates potential volatility around key levels.
 Source: AlphaCryptoSignal Via X
 Why does the $4,400 area act as a supply zone?
Price clustering between $4,150 and $4,400 has produced trapped buyers who sold into weakness, turning that range into a supply zone. Moving averages above price add resistance, and rotation of profit-taking around those levels increases selling pressure. Historical trade flow and order-book snapshots (exchange-level data) support this assessment.
When could ETH regain bullish momentum into Q4?
ETH is more likely to regain clear bullish momentum after a sustained close above the 9-day EMA and then the 50-day SMA with rising volume and falling volatility. Historically, Q4 rallies have followed stabilizing Q3 action; past cases (2017, 2020, 2021, 2023) show stronger year-end flows and retail re-engagement supporting upside.
Frequently Asked Questions
What are the immediate support levels for ETH if it fails at $4,150?
If ETH cannot sustain above the 9-day EMA, immediate support lies between $3,400 and $3,600. These bands historically hosted accumulation and are reinforced by layered buy orders and previous swing lows.
How should traders interpret the recent rise in open interest?
Rising open interest (≈+1.91%) with a sharp volume spike suggests traders are building positions ahead of a decisive move. Interpretation depends on whether volume favors longs or shorts; current data shows a near balance, implying potential volatility rather than a clear breakout.
Key Takeaways
- Resistance pressure: Short-term moving averages and a $4,400 supply zone cap upside around $4,150.
- Futures buildup: Volume up ~39% and open interest +1.91% signal trader positioning and possible increased volatility.
- Q4 watch: Historical Q4 strength suggests upside potential if ETH reclaims key EMAs; monitor on-chain flows and volume for confirmation.
Conclusion
Ethereum resistance near $4,150 is the immediate technical battleground. Ethereum resistance, moving averages, and a clustered supply zone around $4,400 are the defining factors for near-term direction. With futures activity rising and historical Q4 patterns favoring year-end rallies, market participants should watch EMA closes, volume, and open interest for confirmation. For ongoing coverage and level updates, follow COINOTAG analysis and exchange-provided data.