Why the Black Friday Crash Is Not Enough to Stop ZEC’s Rebound Above $300
Privacy-focused cryptocurrency Zcash (ZEC) has defied last Friday’s market-wide crash triggered by renewed US–China tariff tensions, which sent most altcoins sharply lower. While the broader crypto market shed over $20 billion in value, ZEC’s value has since surged by 19%.
Despite the heavy losses across many assets, on-chain and technical indicators suggest that ZEC’s upward momentum may persist.
ZEC’s $300 Cluster Draws Traders In
According to data from Coinglass, ZEC’s liquidation heatmap shows a dense capital cluster slightly above its current price level at $300.56.
Liquidation heatmaps help traders spot price levels where a large number of leveraged positions could be wiped out. They highlight zones of high liquidity, often color-coded, with brighter areas indicating heavier liquidation potential.
Usually, these zones act as magnets for price action, as the market tends to move toward these areas to trigger liquidations and open fresh positions.
For ZEC, the concentration of liquidity around $300.56 signals strong trader interest in buying or closing short positions at that price, pointing to the possibility of a near-term price rally.
Furthermore, on the daily chart, the setup of ZEC’s Moving Average Convergence Divergence (MACD) confirms this bullish outlook. At press time, the token’s MACD line (blue) rests above its signal line (orange), a trend widely regarded as a bullish momentum signal.
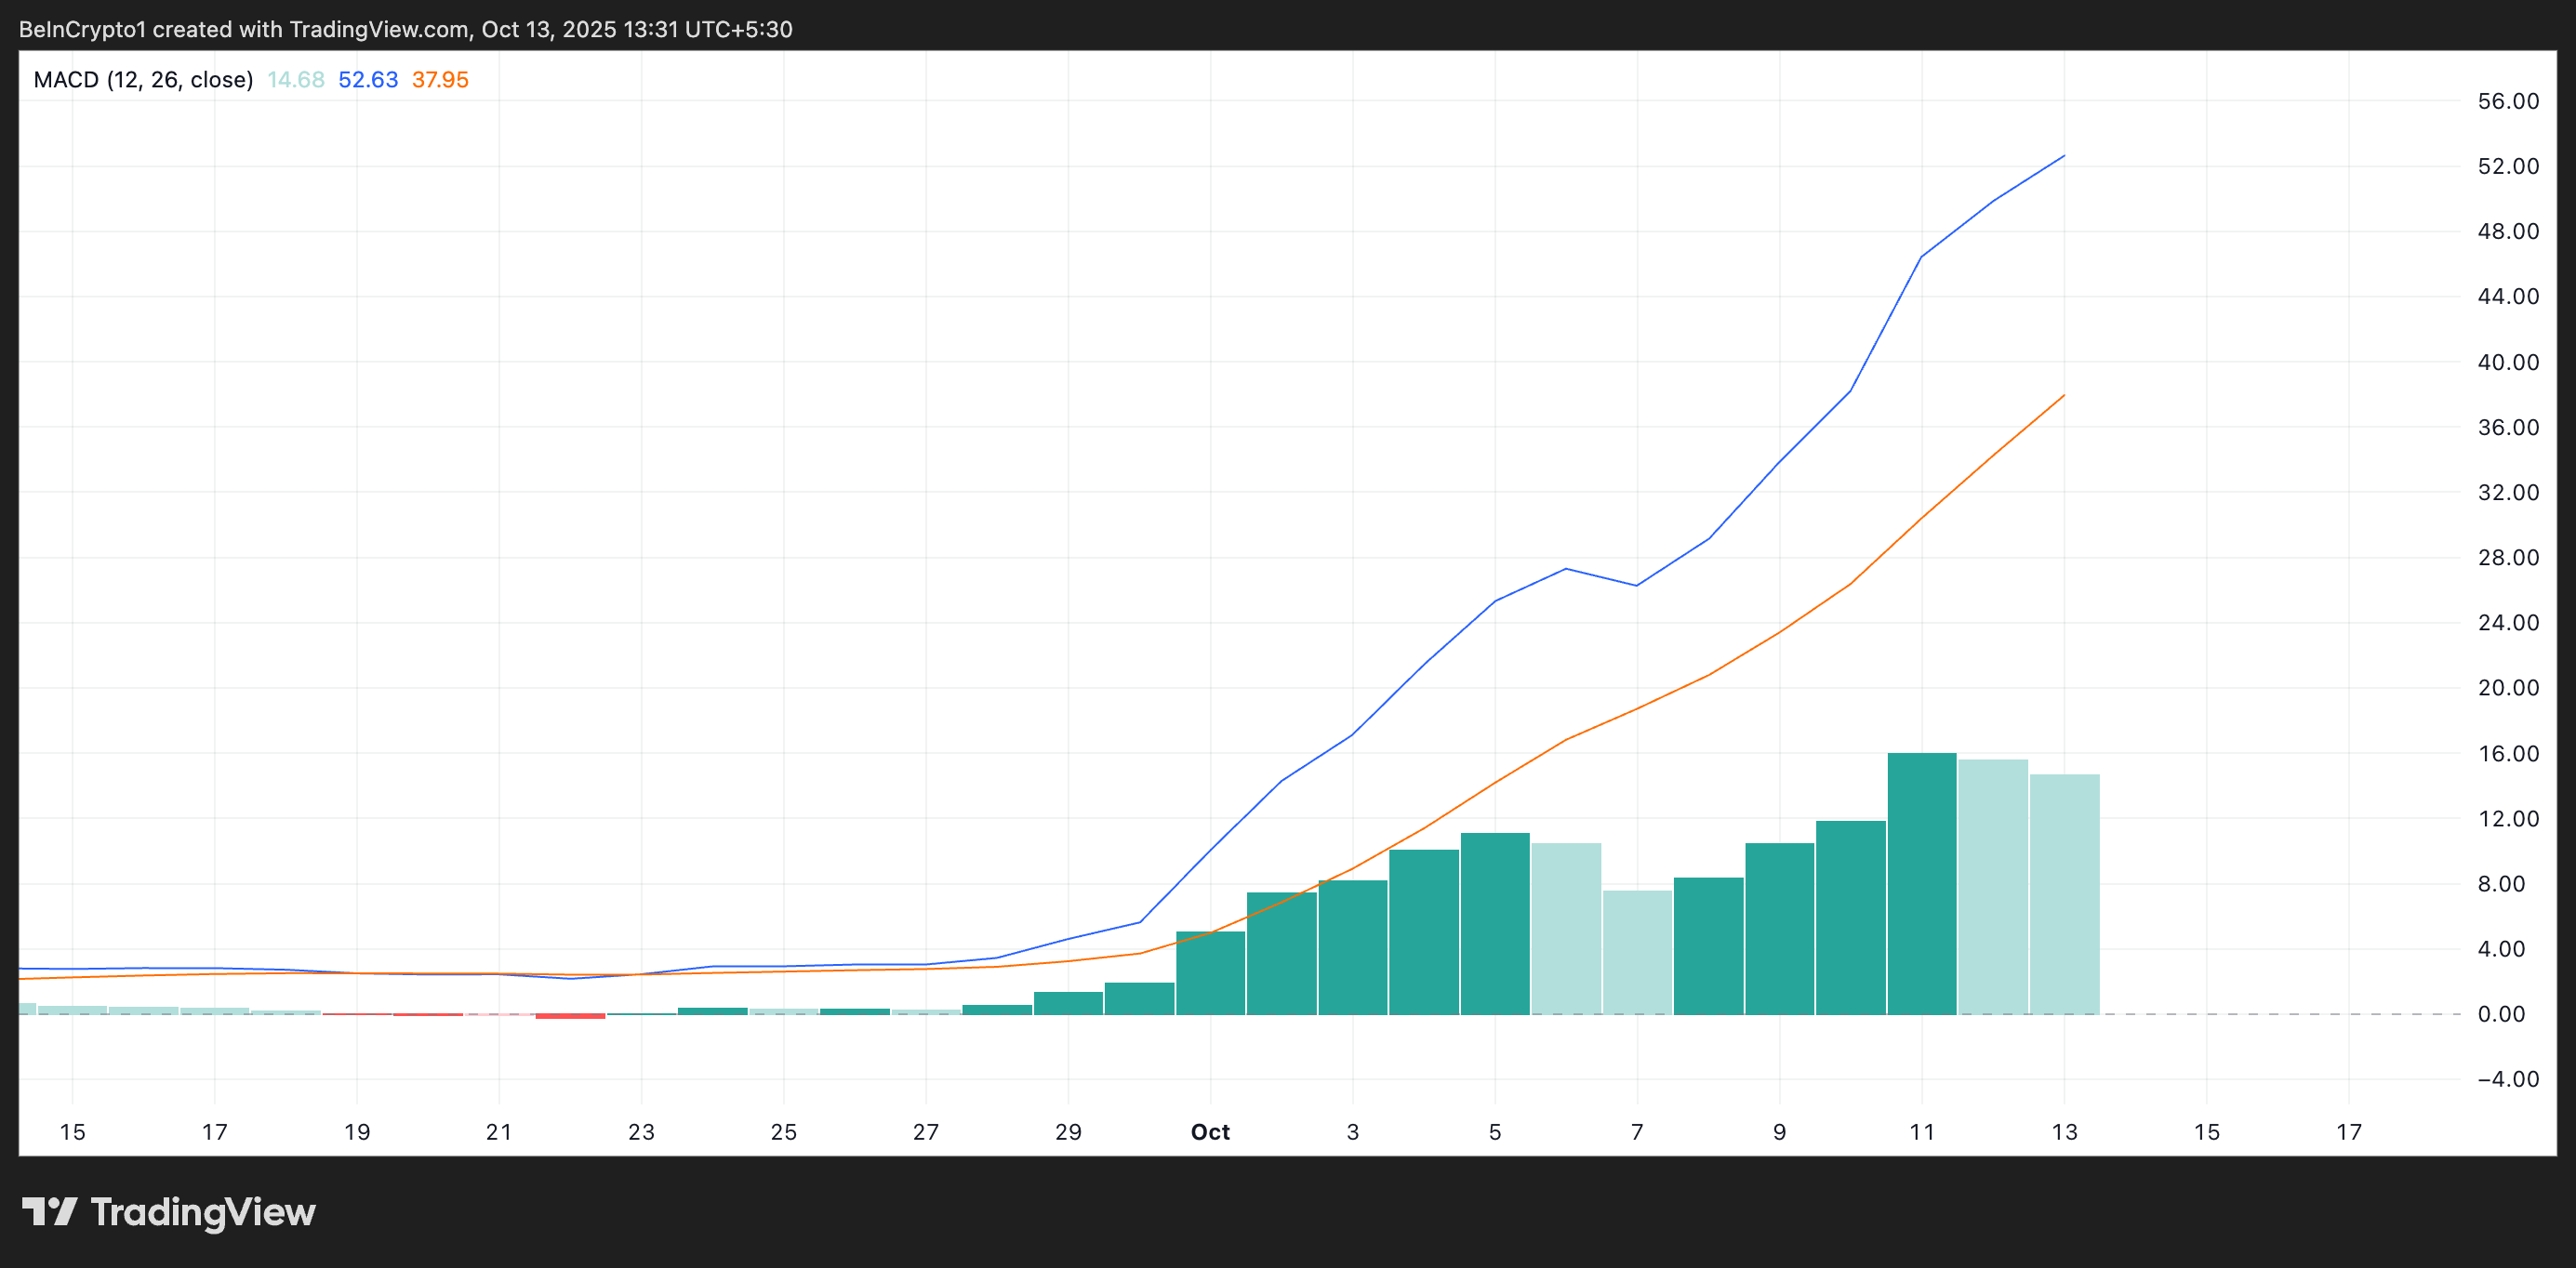 ZEC MACD. Source:
 An asset’s MACD indicator identifies trends and momentum in its price movement. It helps traders spot potential buy or sell signals through crossovers between the MACD and signal lines.
When the MACD line is above the signal line, it indicates buy-side pressure and suggests that ZEC’s price may continue to rise.
Can Buyers Hold the Line at $270?
If this accumulation trend continues, ZEC could sustain its rally, climb above the psychological $300 level, and regain its four-year high of $305.
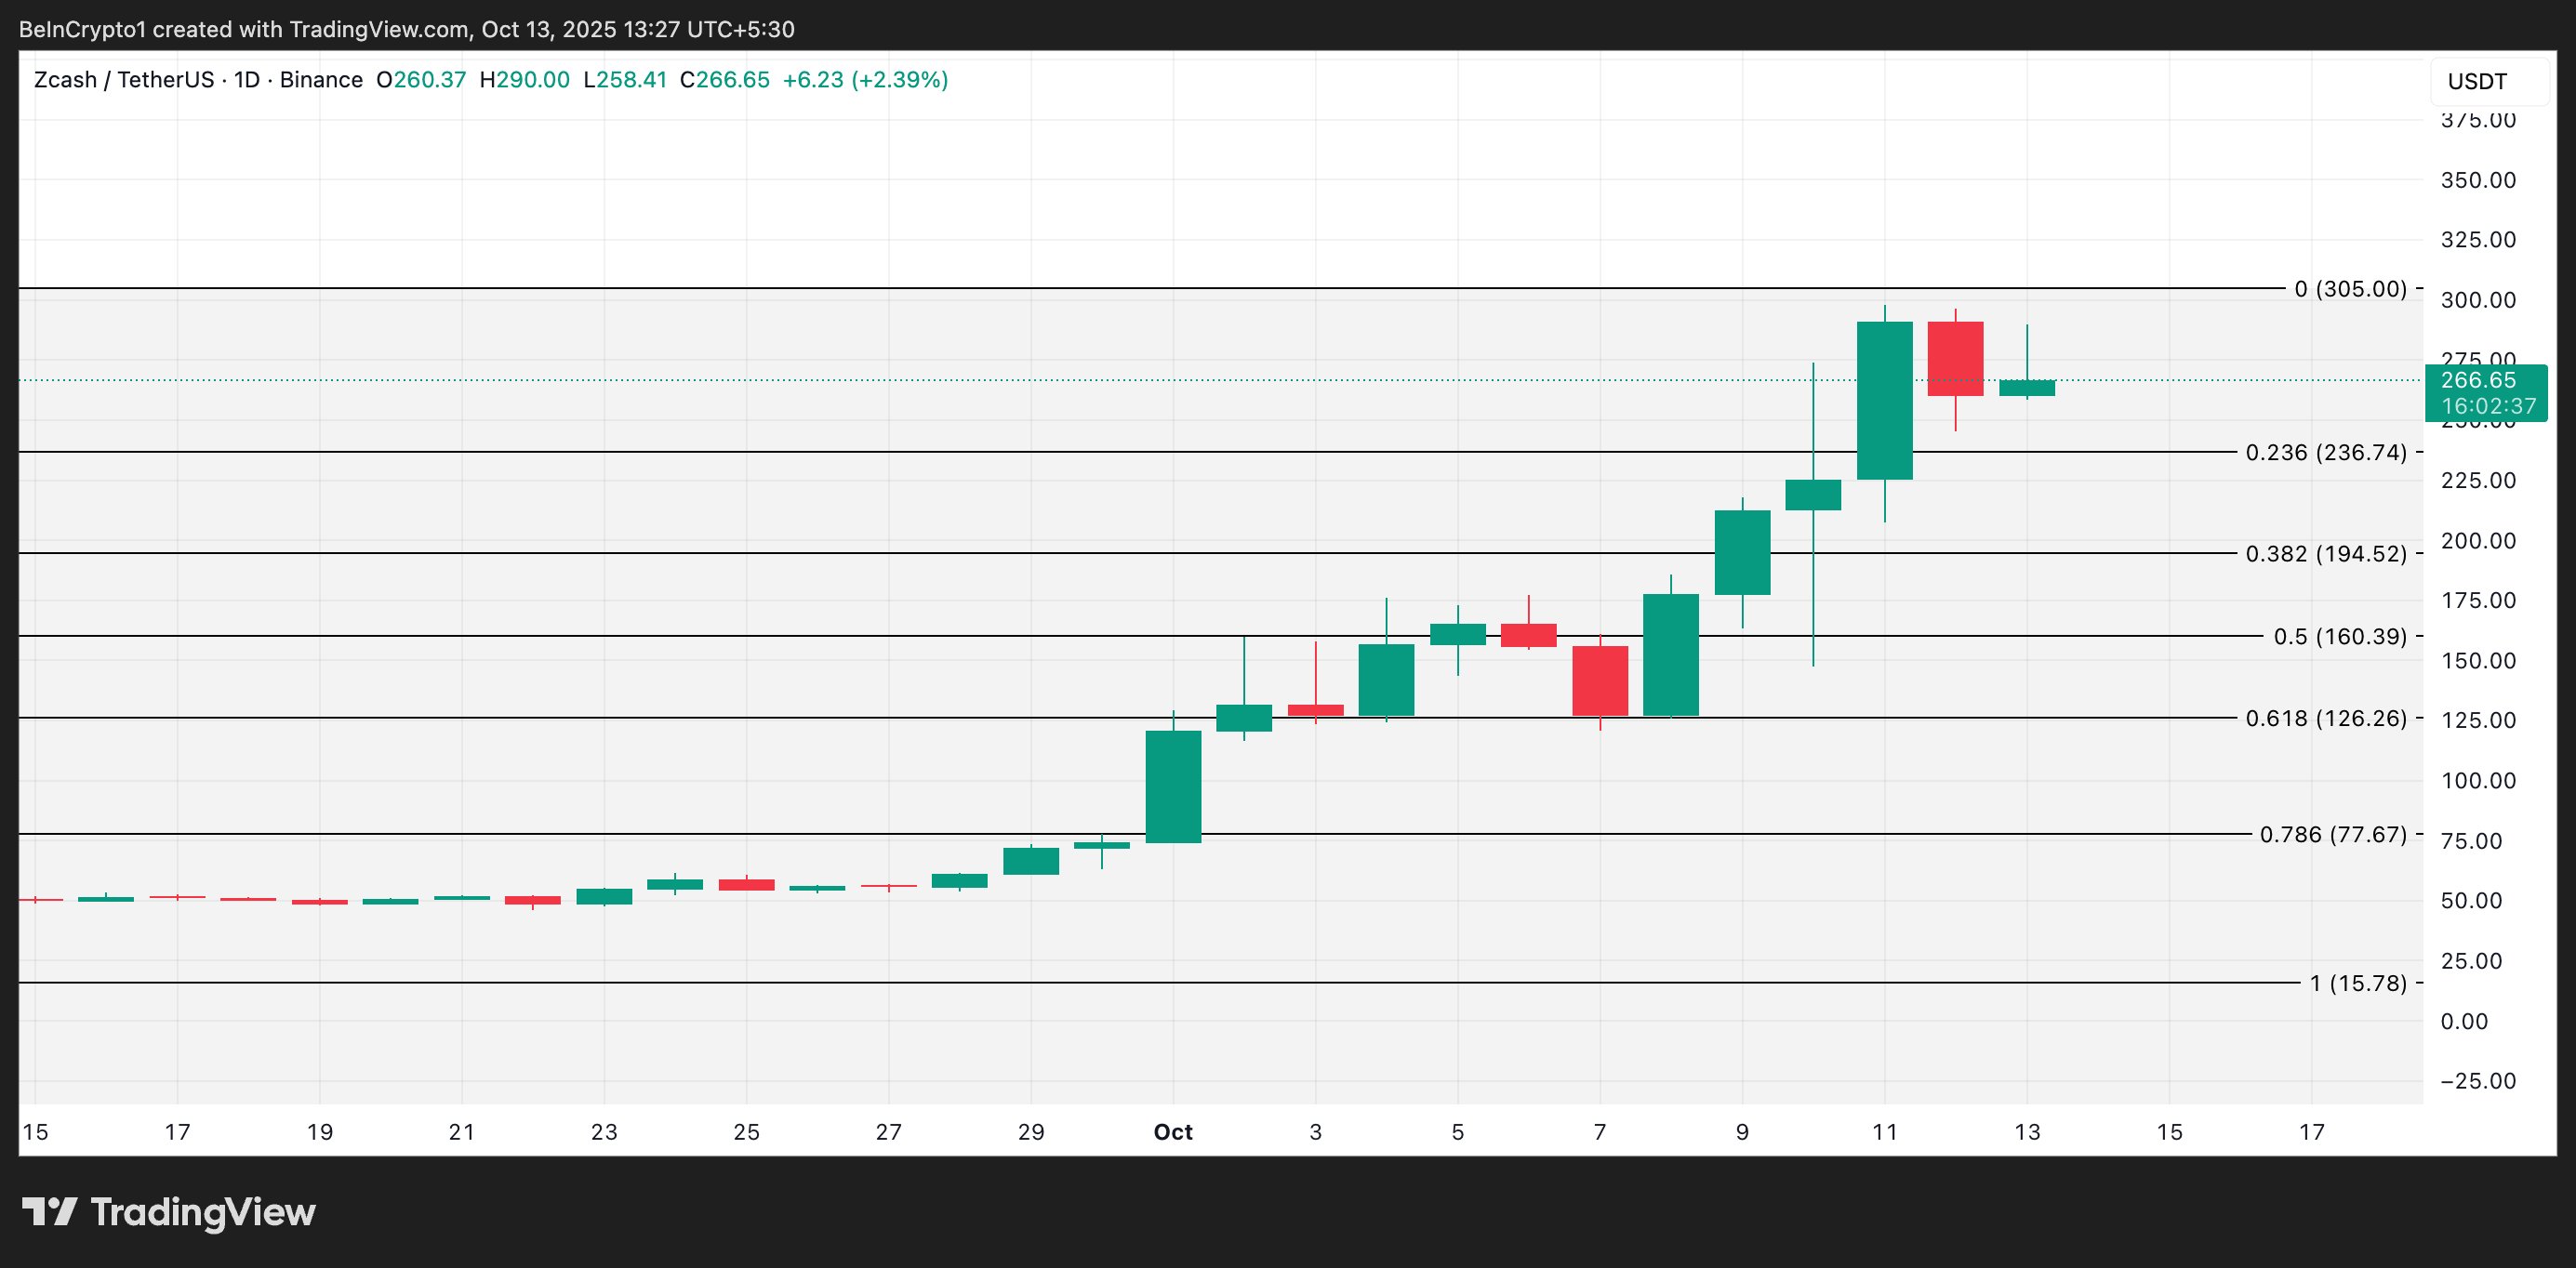 ZEC Price Analysis. Source:
 However, failing to maintain buying pressure around $270 may expose it to short-term corrections before another upward leg. In this scenario, its price could fall below the support at $234.74 and dip toward $194.52.