Date: Fri, Oct 17, 2025 | 09:20 AM GMT
The cryptocurrency market is facing another turbulent day as both Bitcoin (BTC) and Ethereum (ETH) saw a 24-hour decline of over 5%, sparking widespread weakness across the broader market. In the past 24 hours alone, total liquidations have crossed the $1.20 billion mark, with a staggering $943 million wiped out from long positions.
Following this trend, major altcoins have also come under pressure — including Solana (SOL), which has slipped by 8% today. But despite the bearish sentiment, SOL’s chart is quietly revealing a potential bullish setup, suggesting a rebound might be on the horizon.
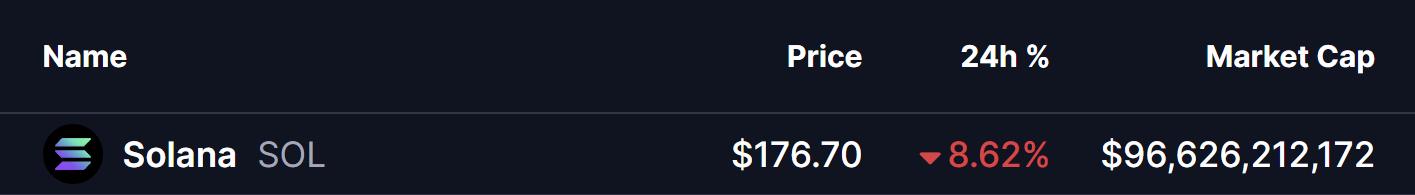 Source: Coinmarketcap
 Bearish Gartley Pattern in Play?
On the 4-hour chart, SOL appears to be forming a Bearish Gartley harmonic pattern — a well-known formation that, despite its “bearish” name, often signals an upward reversal in its CD leg.
The structure began at Point X near $239.79, followed by a sharp drop to Point A, then a rebound toward Point B, before extending lower again — pushing SOL today into the $175 region, where the next potential pivot point C could be forming.
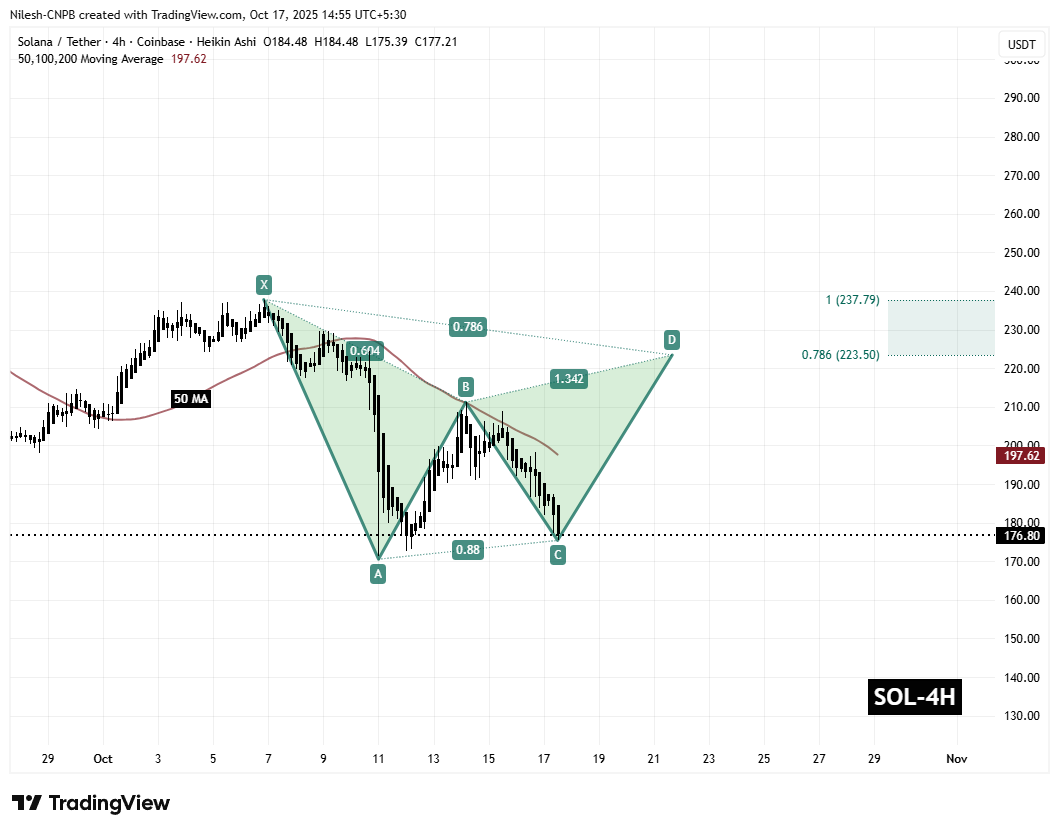 Solana (SOL) 4H Chart/Coinsprobe (Source: Tradingview)
 If buyers manage to hold this area, it could confirm the C point, setting up the stage for a bullish CD leg — the phase that often leads to a short-term recovery in harmonic setups.
What’s Next for SOL?
If the $175 (C) support zone holds firm, SOL could see a reversal toward the 50-period moving average near $197.62, which would strengthen the bullish case. A successful bounce from there might open the path toward $223.50–$239.79, aligning with the 0.786 and 1.0 Fibonacci extension levels — a move that would represent a potential 34% upside from current prices.
However, a failure to defend $175 could delay the confirmation of C, allowing sellers to regain control and potentially push SOL to new local lows before any rebound attempt.