Massive XRP Liquidity Cluster Emerges Above $3.2 as Price Holds Key $2.38 Support
- There is a large liquidity pool at the levels of more than $3.2 which are signs of high leverage positioning in the XRP market.
- The support is also relatively high at $2.38 and it is not allowing it to decline further, albeit, by 3.9 percent per week.
- The level of resistance at $2.53 still limits the upward momentum as the traders await an outbound of the range.
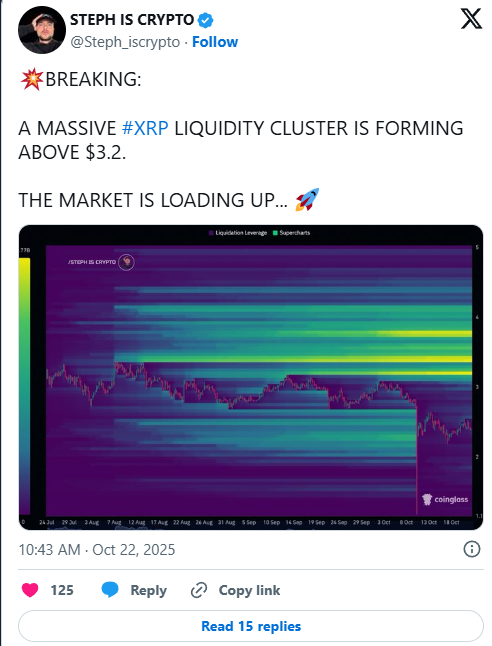
A massive liquidity cluster is forming above the $3.2 mark on XRP’s price chart, indicating an area of concentrated leveraged activity. The data, sourced from Coinglass, shows heightened liquidation leverage zones that could soon define short-term volatility.
XRP is trading at $2.40, which is a reduction of 3.9% in the last seven days, whilst its BTC counterpart is trading at 0.00002223 BTC, which has gained by 0.5 percent in the same period. It is important to note that the traders seem to be gaining trades as the token approaches its imminent support level.
Rising Leverage Activity Points to Growing Market Anticipation Amid Ongoing XRP Consolidation
Recent statistics indicate a growing group of leveraged positions in the range of $3.00 to $3.40 with the highest density being in the range of $3.20. This range has received the focus of traders who are looking forward to directional movement. The bright yellow bands in the Coinglass Supercharts visualization represent increased liquidation leverage, often signaling an area where both long and short positions are stacked.
Nevertheless, even as the accumulation indicates an increase in the market action, XRP is stuck in a very low trading range. The intraday range is not impressive as between $2.38 and $2.53 there is a 24-hour range indicating less intraday momentum. The existing structure is an indication of increased expectation in the market, although unless a breakout is confirmed, then price action will probably be in a state of consolidation around these prices.
XRP Holds Firm at $2.38 Support as Traders Await Clearer Market Direction
Despite the recent 7-day decline, XRP has managed to hold above a firm support level of $2.38. This area has repeatedly cushioned price drops over recent sessions, preventing deeper losses. Market participants are closely observing whether this level can sustain ongoing sell pressure as liquidity clusters grow above.
Moreover, the relative stability of XRP around support implies that short-term sellers might be depleted. Nonetheless, increasing volume is not seen to be that high, which means that the buyers are not becoming aggressive until there is more certainty on the direction to follow. This stage usually follows the intervals of high volatility particularly where the liquidity accumulates in upper resistance areas.
Resistance Builds at $2.53 as Cluster Expands
On the upper side, the $2.53 resistance continues to limit XRP’s recovery attempts. The zone aligns with part of the emerging liquidity concentration visible on Coinglass charts. If the price approaches this resistance, increased liquidation activity may occur due to tight leverage positioning.
Consequently, traders are watching both key levels — $2.38 support and $2.53 resistance — for short-term cues. Liquidity clustering above $3.2 suggests that once volatility expands, substantial price reactions could follow. Until then, XRP’s movement between support and resistance defines a restrained but critical setup for the coming sessions.