Solana Price on the Edge — A Sharp Break Could End the Buyer-Seller Stalemate
Solana’s price is caught between stubborn buyers and active sellers, with neither side backing off. The coin is up 4.5% in the past 24 hours but still down 7% over the month, showing how every bounce gets met with selling pressure.
Now, on-chain and chart signals suggest this standoff may be nearing a turning point.
Long-Term Sellers Slow Down, Short-Term Traders Shift Gears
The Hodler Net Position Change, which tracks whether long-term investors are adding or selling, remains negative — meaning Solana holders are still cashing out. But the pace of selling has eased sharply.
On October 3, long-term holders sold around 11.43 million SOL, compared to 4.55 million SOL on October 23. That’s a major 60% drop in selling pressure. They’re not buying yet, but they’re clearly slowing down, a pattern that often appears near local bottoms.
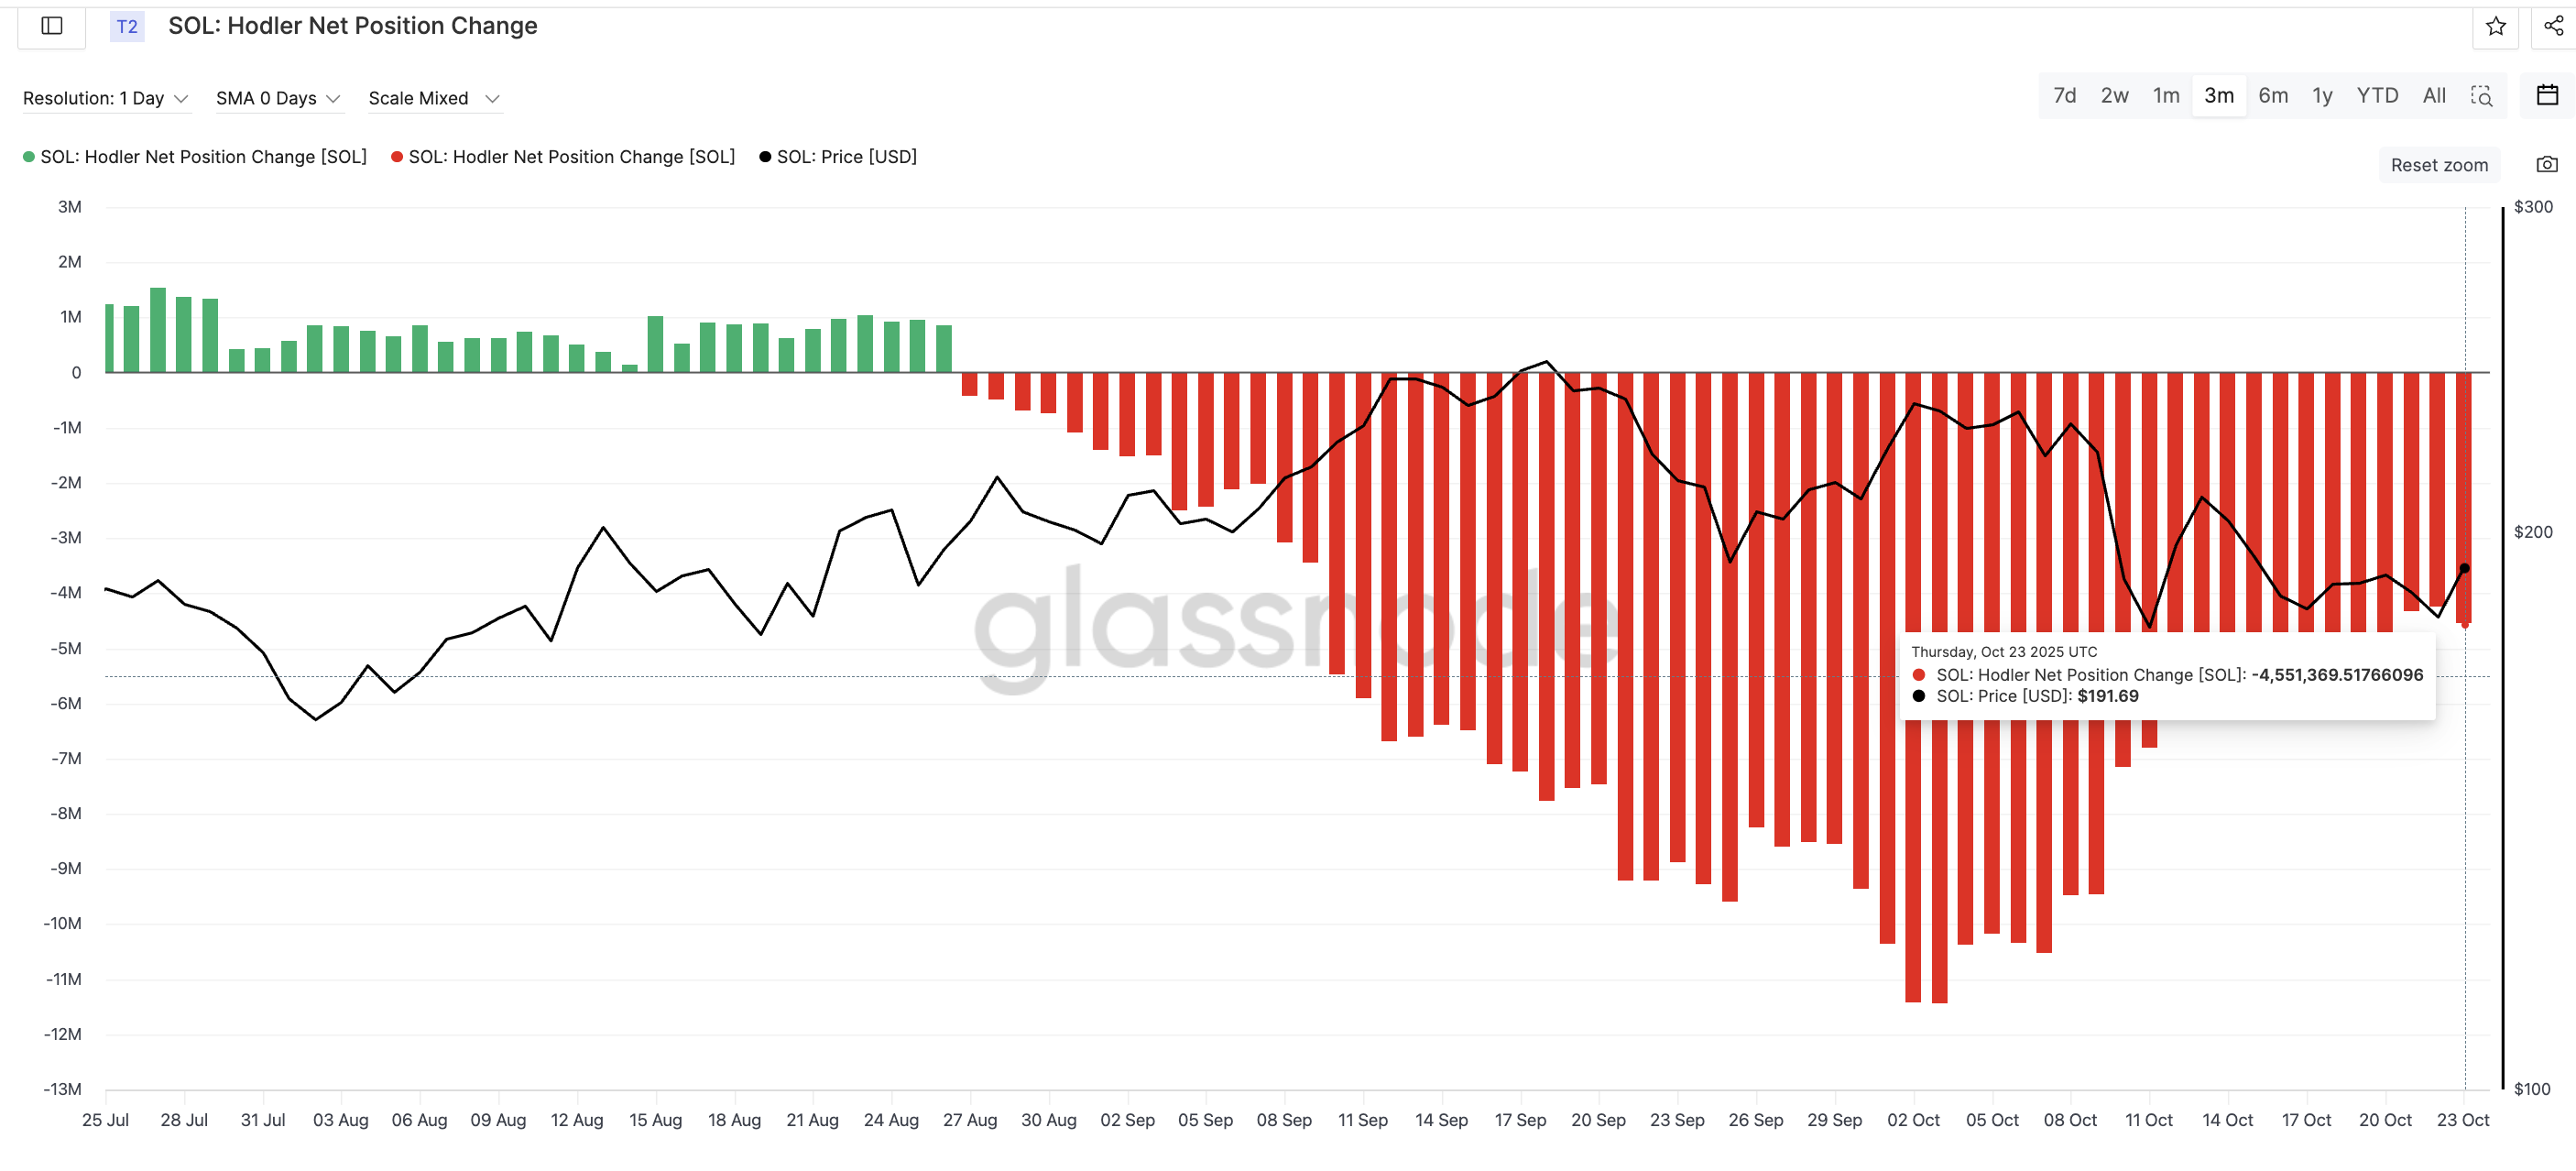 Long-Term Investors Selling Fewer SOL: Glassnode
 To see what short-term traders are doing, the HODL Waves metric breaks down supply by holding duration.
It shows that 1-week–1-month wallets cut their share from 14.88% on October 9 to 10.87% on October 23, suggesting traders might have been taking profits on small rallies.
Want more token insights like this? Sign up for Editor Harsh Notariya’s Daily Crypto Newsletter
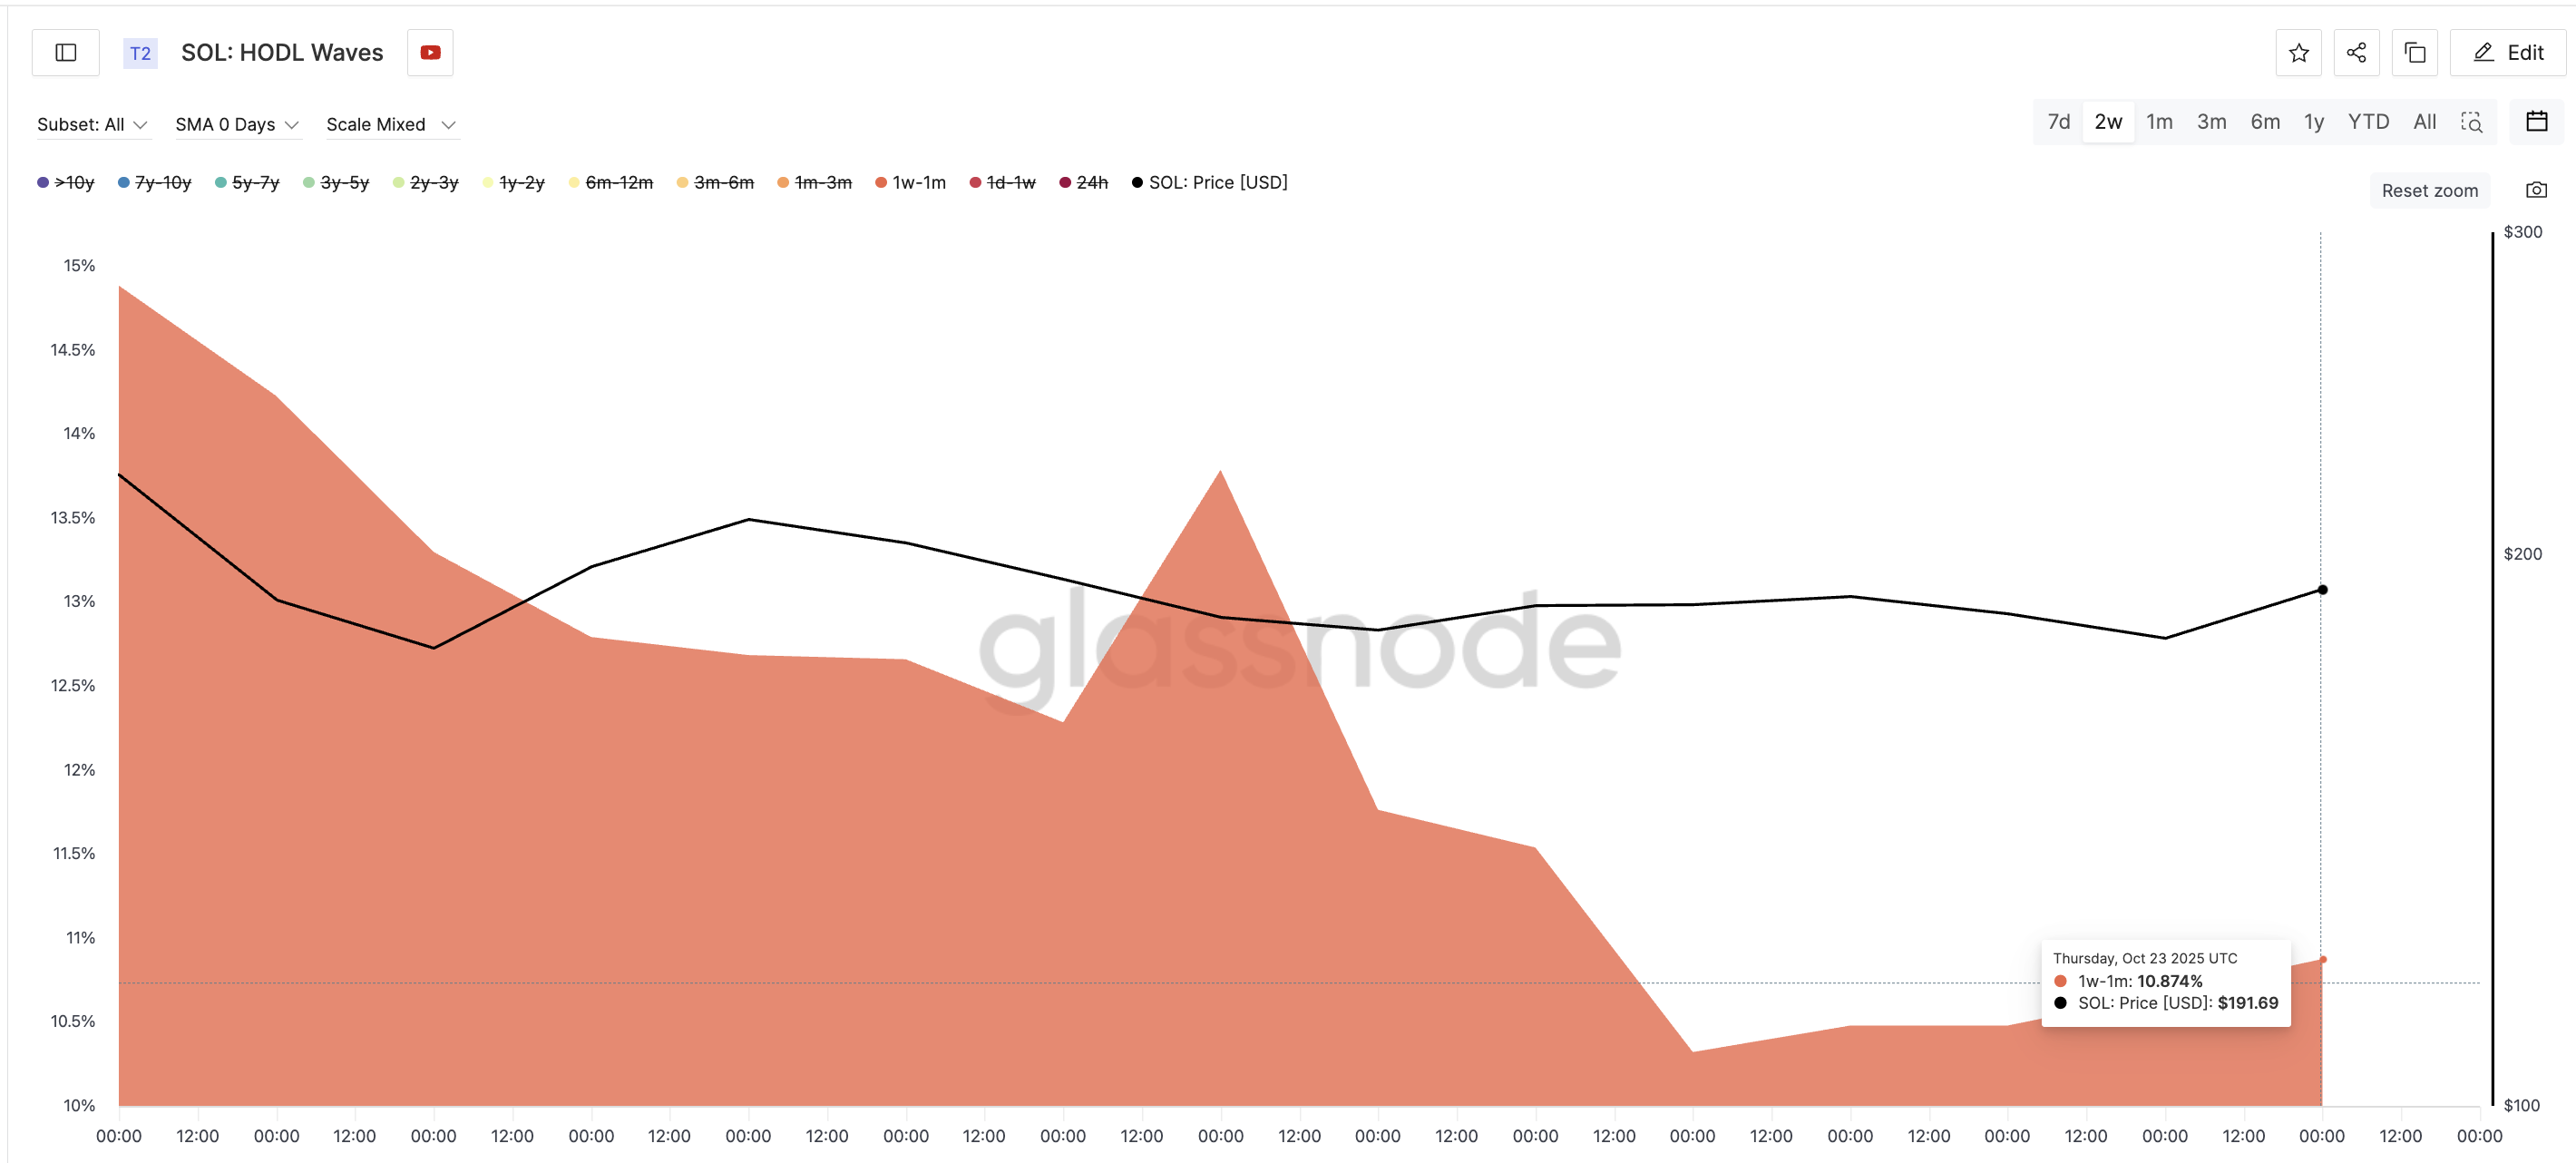 Short-Term Holders Dumping: Glassnode
 Meanwhile, the 1–month–3–month group raised its share from 15.21% to 18.66%, showing that slightly longer-term players are quietly buying dips.
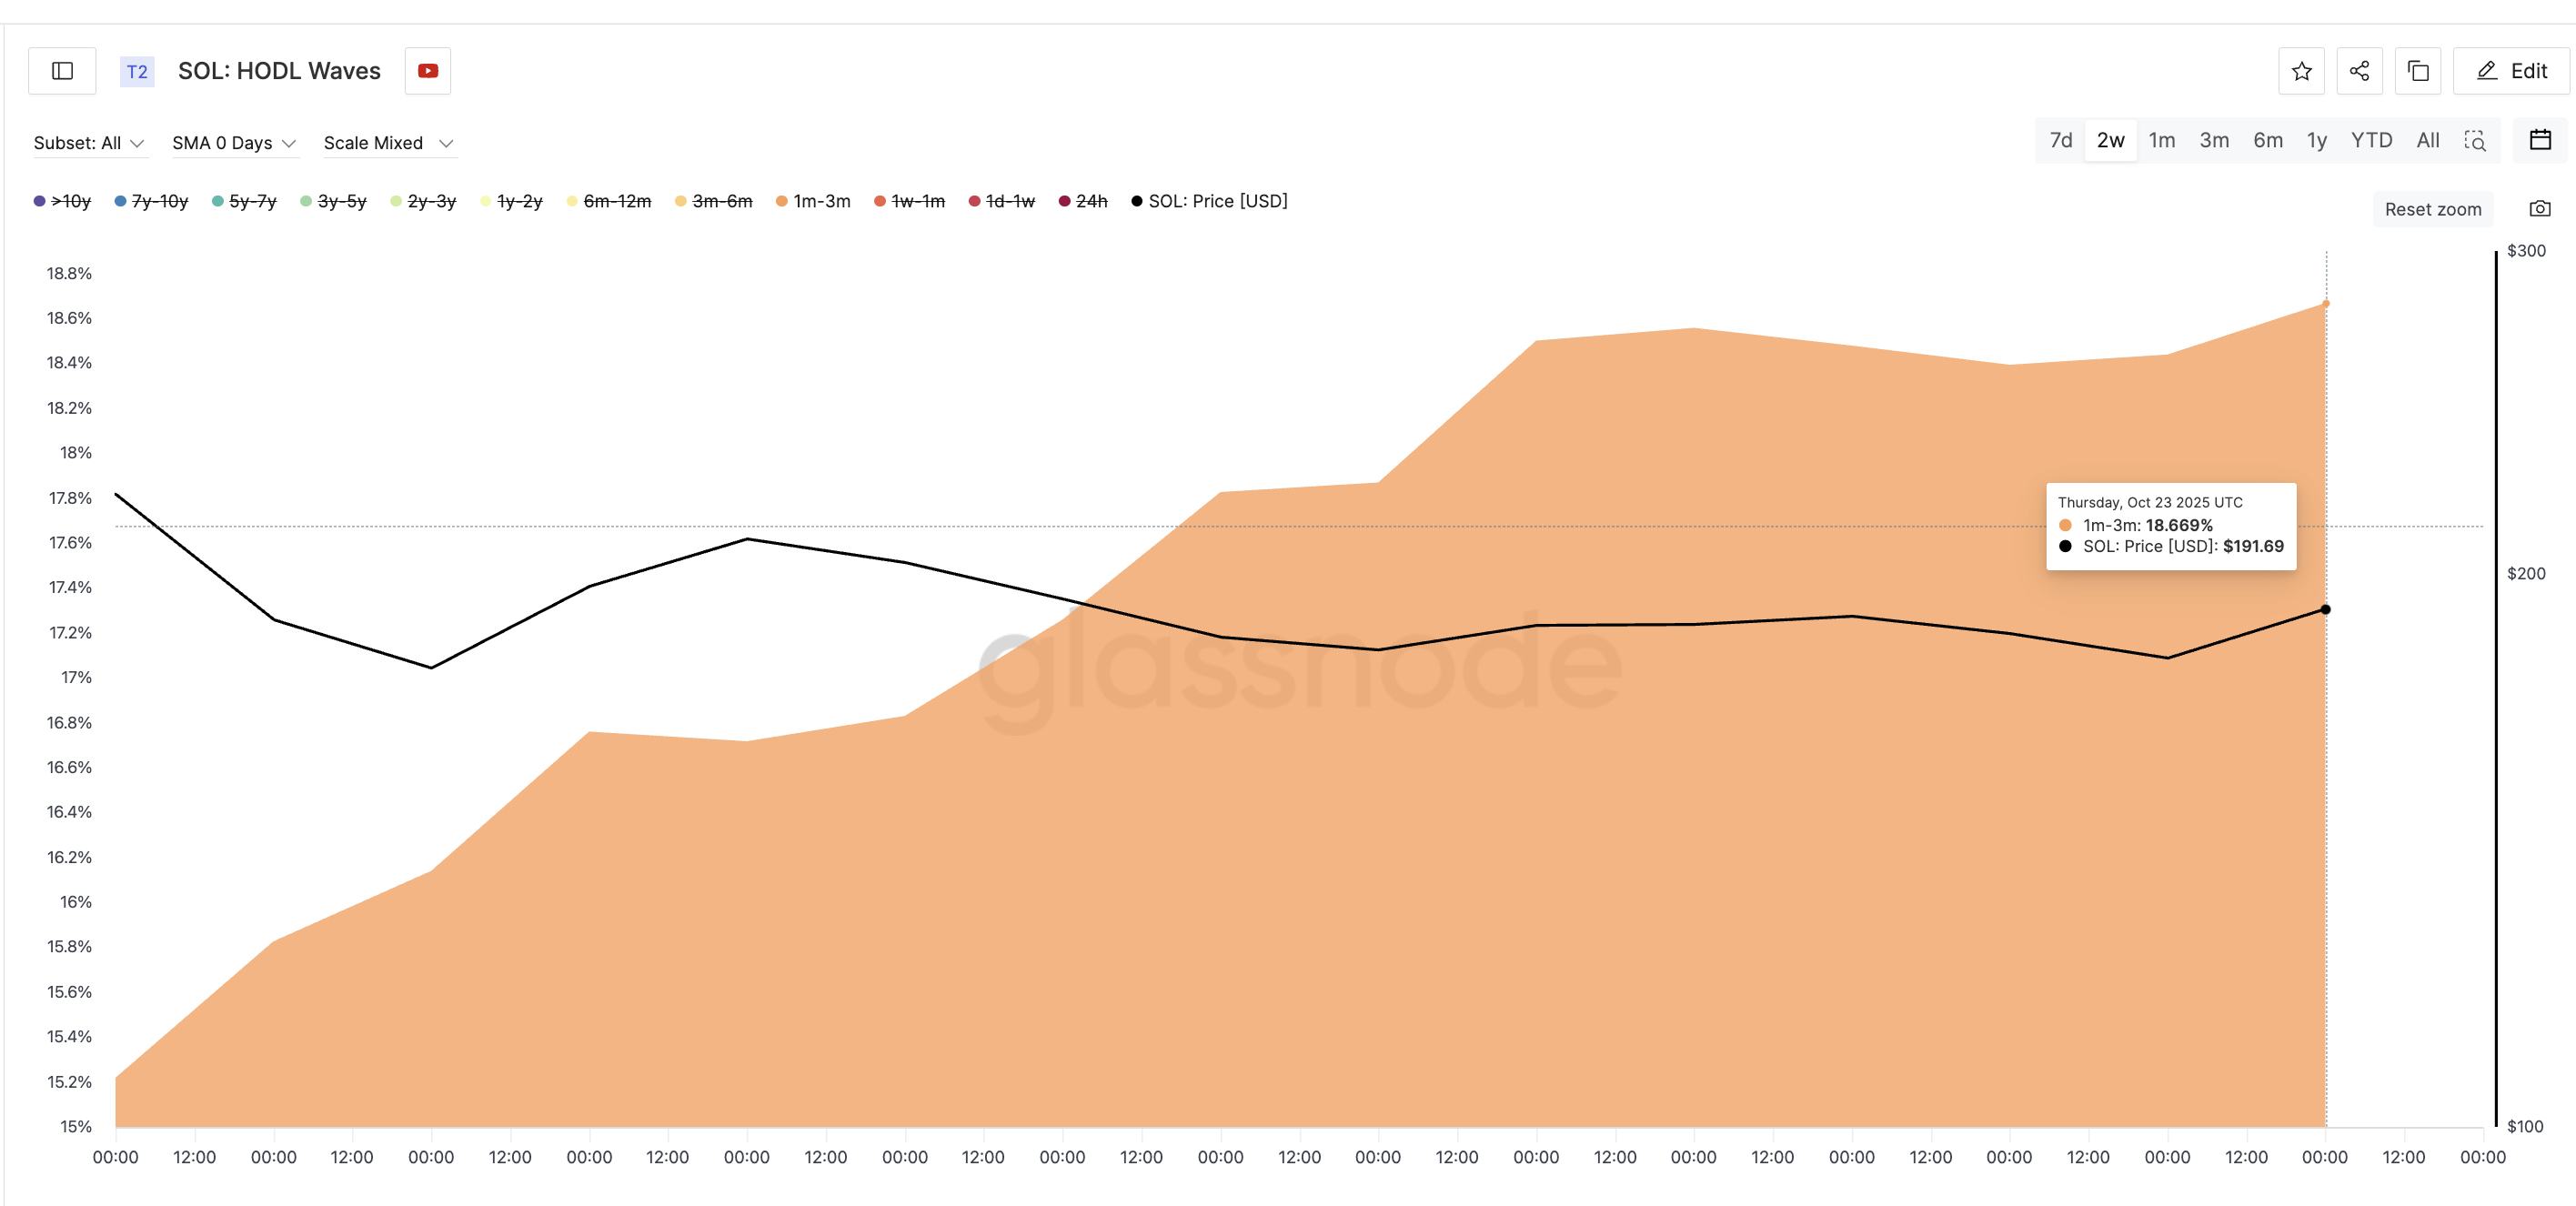 Mid-Term Solana Holders Buying: Glassnode
 In simple terms, short-term sellers are fading out, mid-term buyers are stepping in, and long-term holders are just waiting. That balance explains why SOL has stayed in a range and not dipped massively.
A decisive change in the range-bound nature of SOL price could happen if any of the mentioned groups make a move. For instance, if the long-term investors start buying (position change in green), the Solana price could get a bullish boost.
However, if they continue to sell, aligning with the short-term holders, a price breakdown theory could surface.
Triangle Pattern Sets the Stage for a Solana Price Breakout
On the daily chart, the Solana price has been trading inside a symmetrical triangle since mid-September, a structure that shows market indecision. Each swing high is lower, and each swing low is higher, forming a tightening range.
The fight could end soon. A breakout above $211 would give buyers the upper hand and mark a move beyond the triangle’s top. A breakdown below $174 would signal that sellers have regained control.
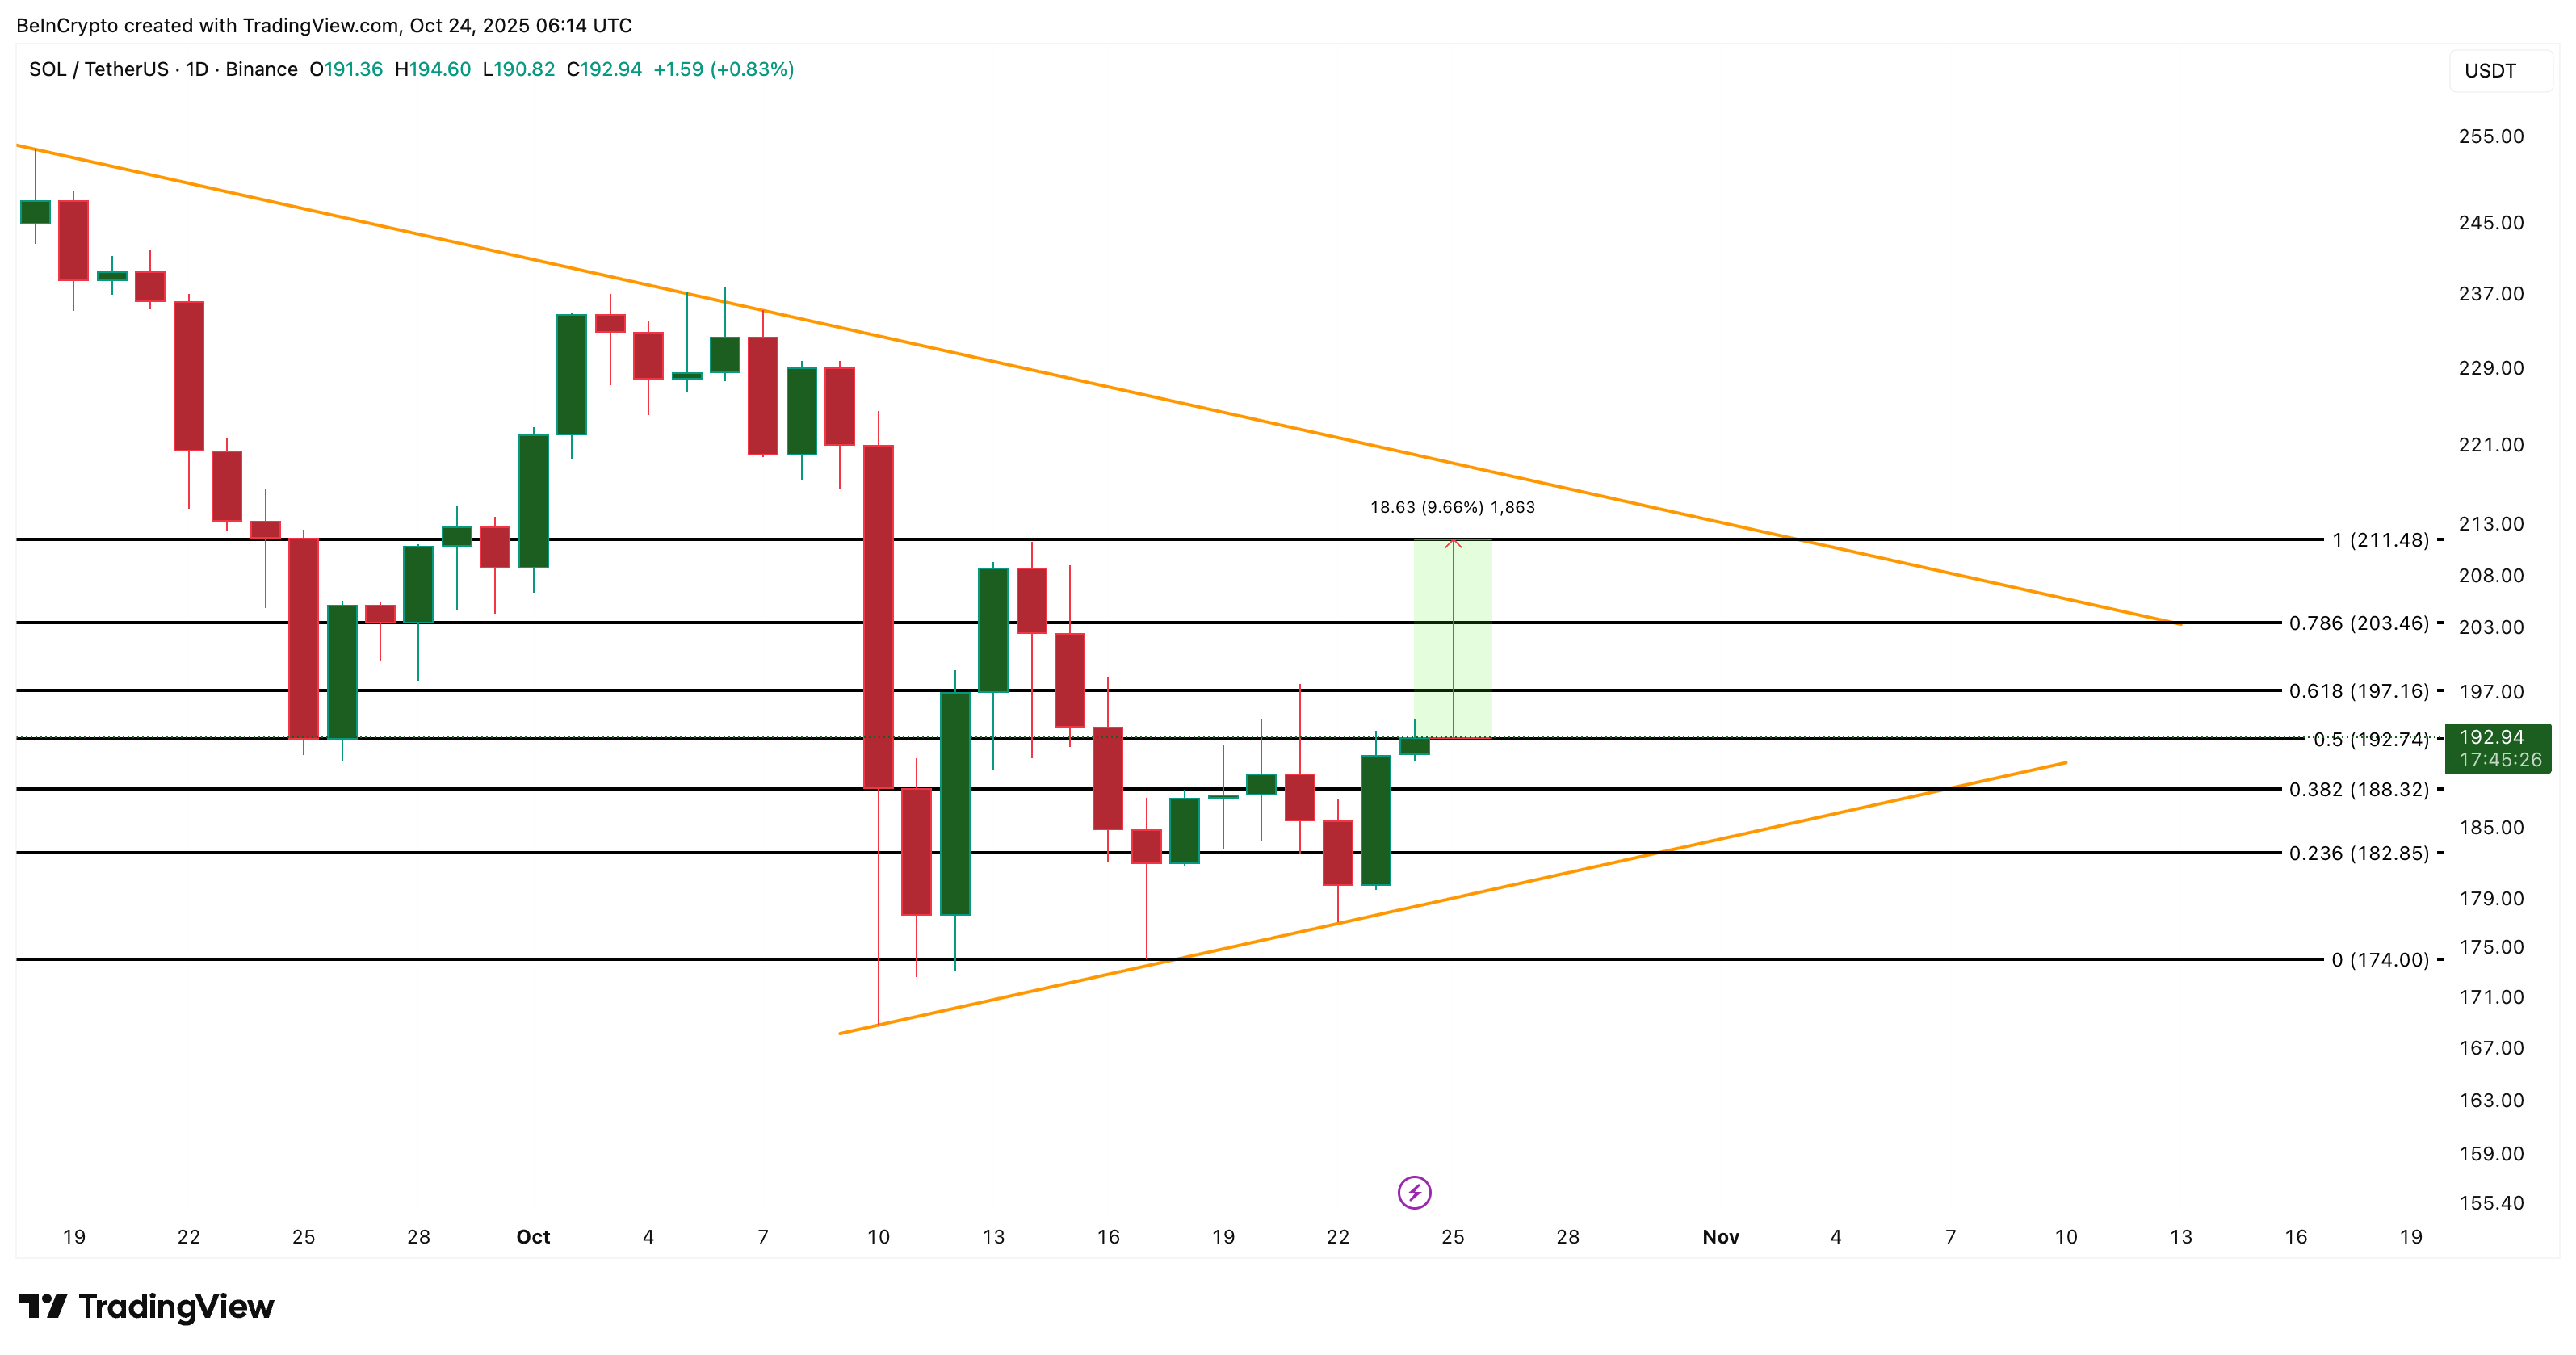 Solana Price Analysis: TradingView
 Until then, $197 serves as the first resistance, and $188 remains key support. A close below $188 could open $174, while a rebound above $197 might kick off a run toward $211 (over 9% surge from the current levels) and higher.
Solana’s buyer-seller battle is still balanced, but not for long. The charts and on-chain data agree: the next decisive break is close.