While Bitcoin hovers at the brink of a potential breakout or rejection, the altcoins are still looking good for a breakout of their own. The charts show that the altcoins are in a healthy position. Are they about to rally into the final stage of this bull market?
Total2 higher highs and higher lows
Source: TradingView
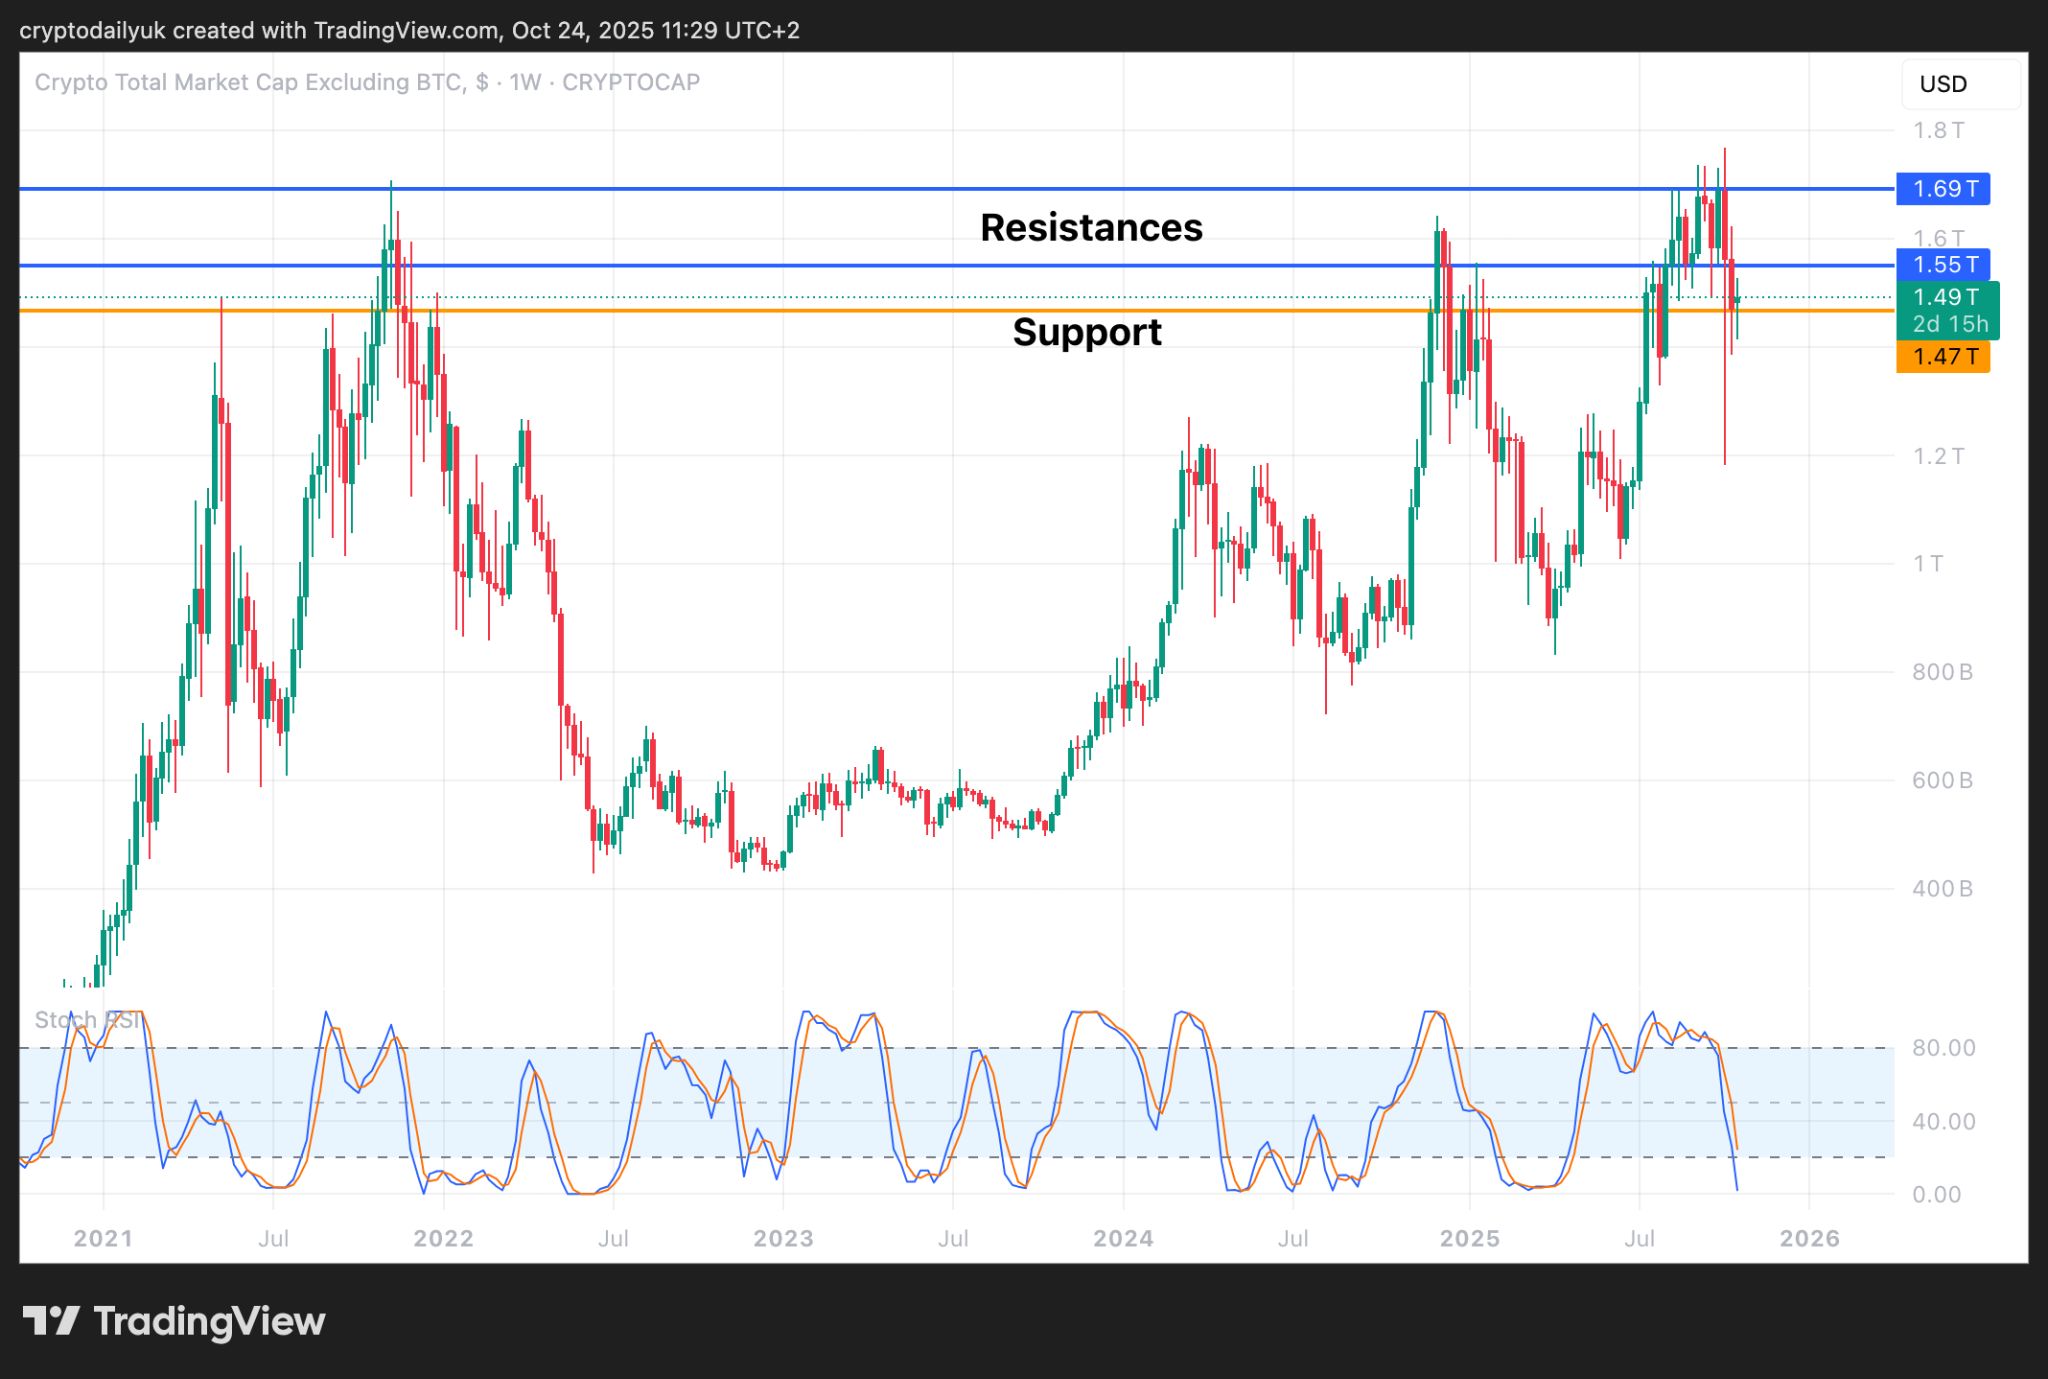
The Total2 chart is of the combined market capitalization of all the altcoins with the exception of Bitcoin. It can be seen that the macro price action has consisted of higher highs and higher lows since the bull market began.
Given that the last high made a new all-time high, this is bullish for altcoins and it might be expected that the market cap continues to climb from here. The altcoin market cap is sitting nicely above horizontal support so this will be an excellent base to move up from.
At the foot of the chart, the Stochastic RSI reveals that the indicators are about to bottom. Once these indicators turn back around this can lead to some strong upward price momentum.
Bitcoin dominance hits major resistance level
Source: TradingView
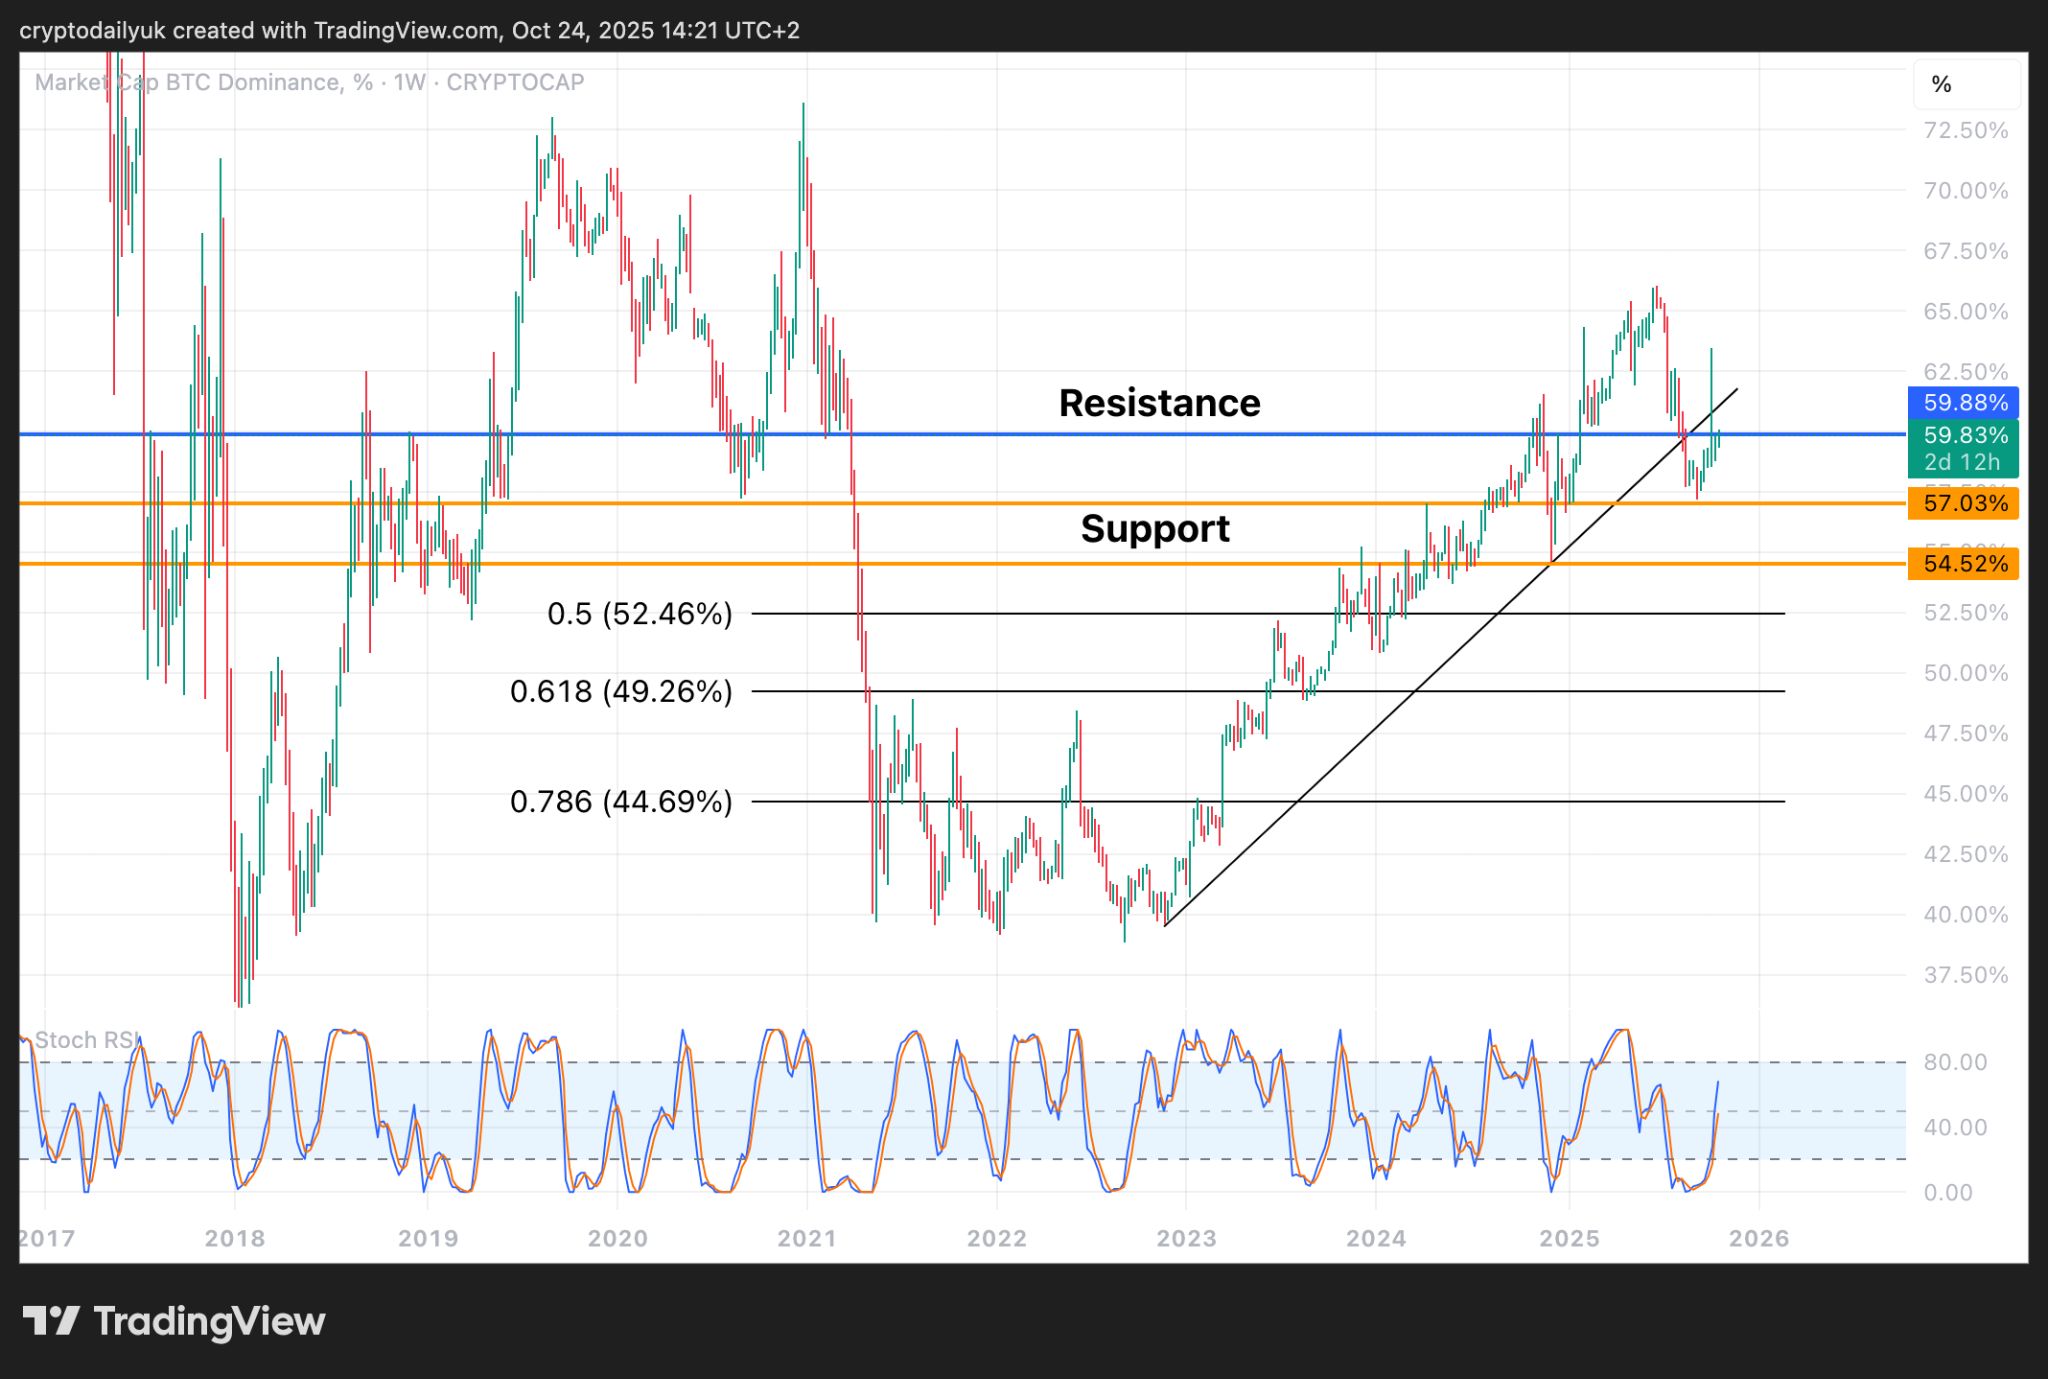
For the altcoins to be truly successful in the rest of this bull market they will need to reduce Bitcoin dominance. The weekly BTC.Dominance chart above illustrates that the long upward trend that stretched from late 2022 has finally been broken. Yes, in the recent huge market crash Bitcoin dominance did spike back up, but it can be seen that the altcoins were rapidly bought up again.
Currently, Bitcoin dominance is up against the 60% resistance level. Given the strength of this horizontal resistance, it might be expected that dominance falls back from here, although there is the chance that the trendline gets another confirmation first.
Once, and if, dominance does begin to fall again, and this would be assuming that Bitcoin breaks above its all-time high, the altcoins are likely to be unleashed, with a certain selection among them outperforming Bitcoin. Going by the Fibonacci extension levels, Bitcoin dominance could fall to 50%, and perhaps even 45% and below.
USDT dominance continues downtrend
Source: TradingView
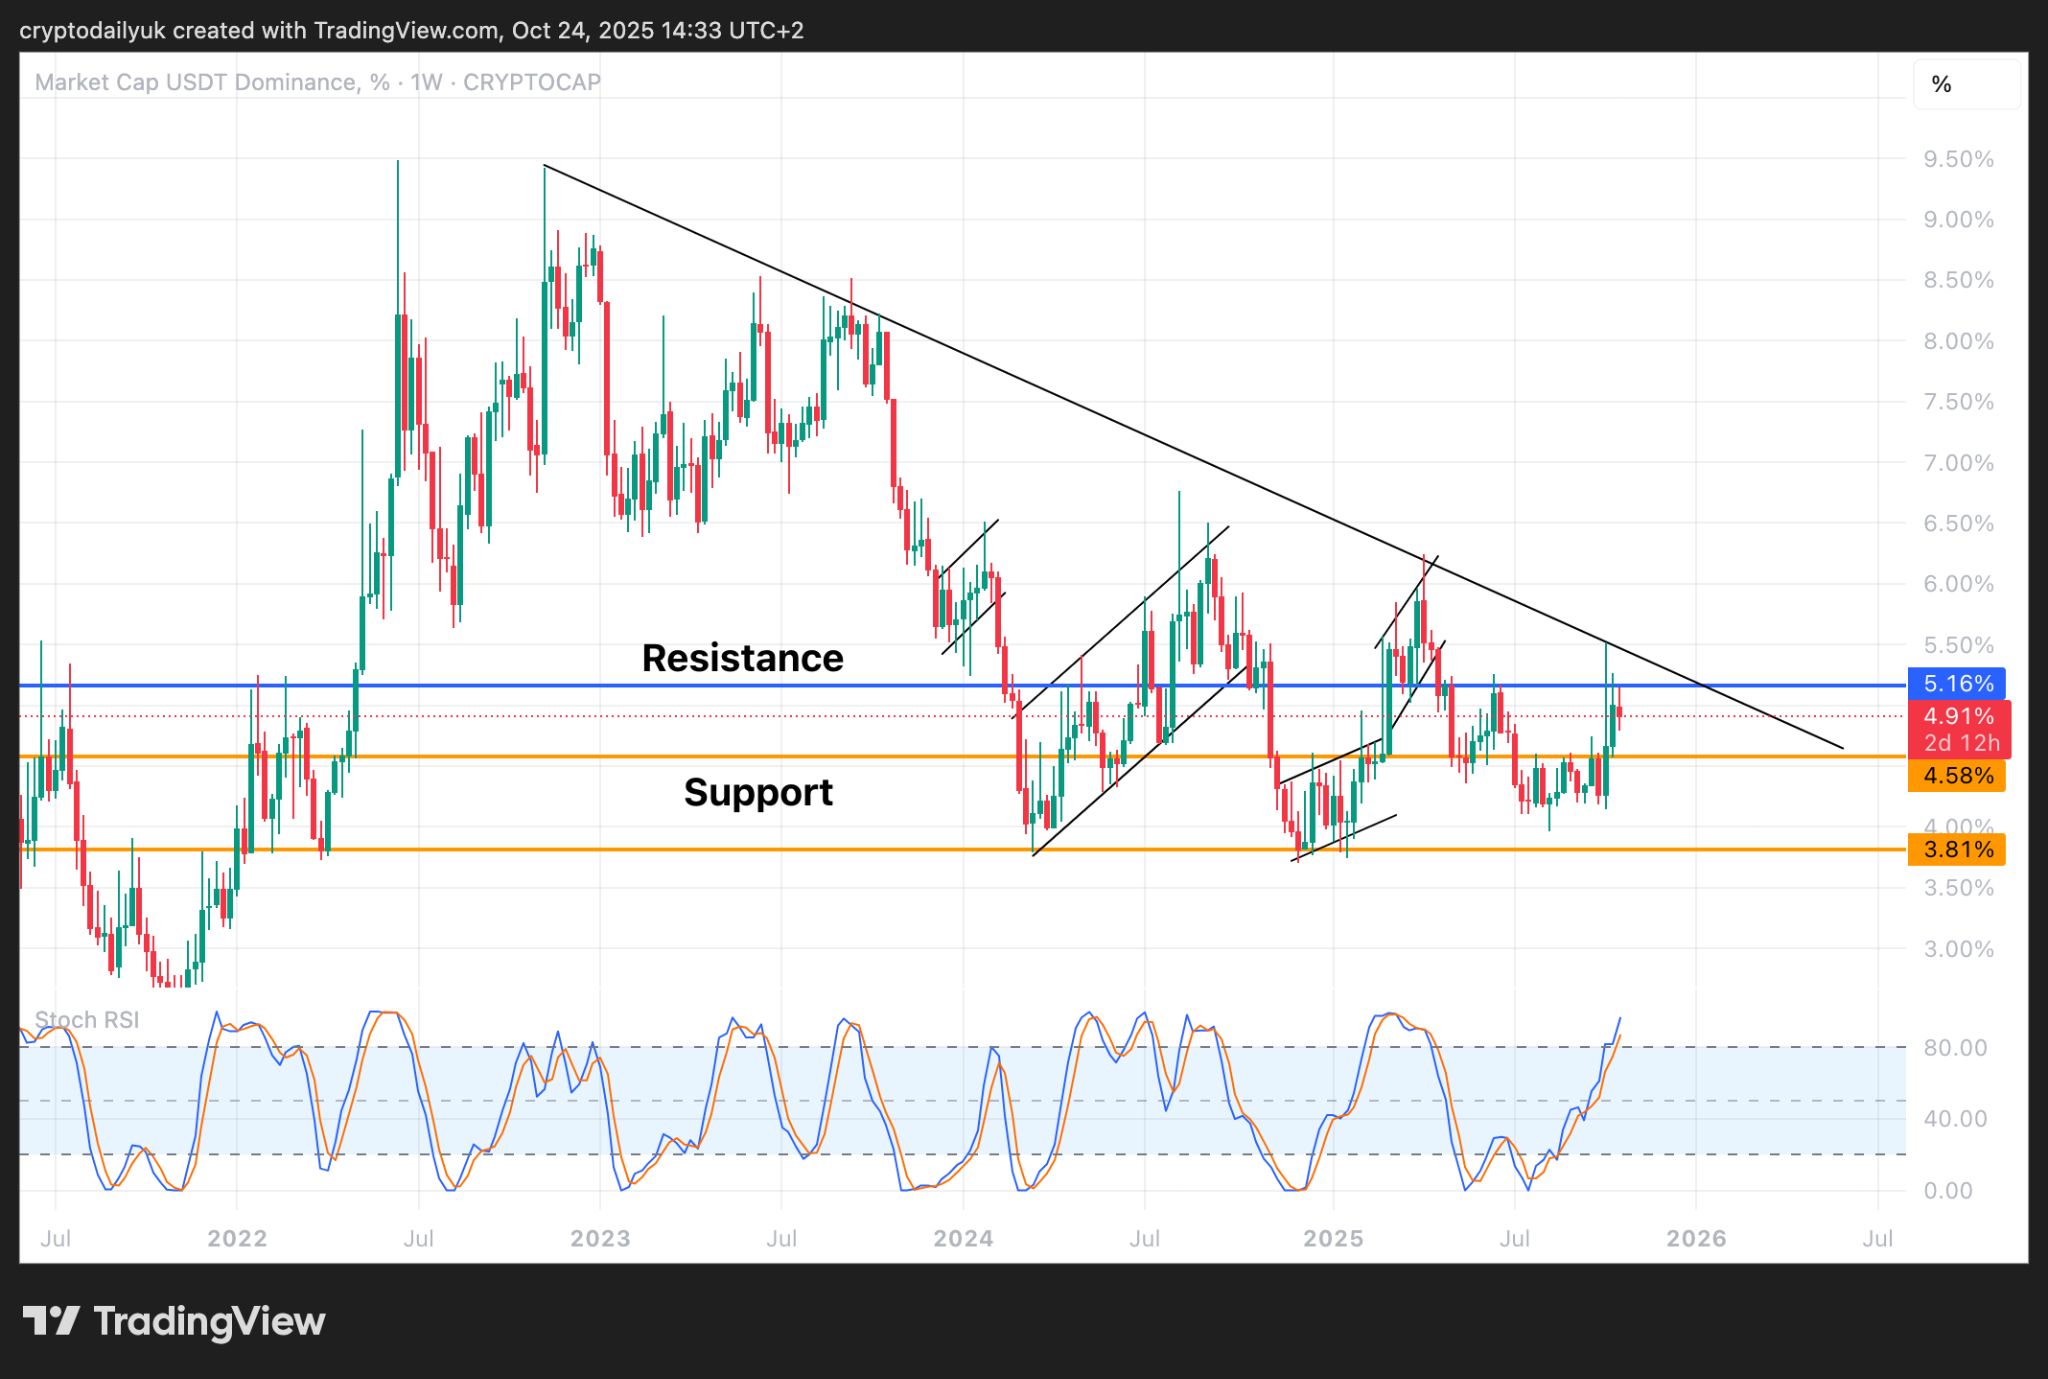
USDT.Dominance is one more indicator of a rising crypto market. It can be observed in the weekly chart above that USDT dominance has been steadily falling since the bull market began. The downtrend line has been retested just recently and dominance was soundly rejected. The 5.2% horizontal resistance line is also doing its job.
Given that the Stochastic RSI indicators are just about reaching the top limit, a cross back down could be imminent. This would reflect in dominance coming back down, possibly to the major 3.8% horizontal support.
It all depends on Bitcoin and the macro economic environment
In conclusion, the altcoins would appear to be ready to run. Of course, this will all depend on Bitcoin. The king of the cryptocurrencies is in a critical position right now. If the bulls can lift the Bitcoin price out of its present predicament, it could be game on and the altcoins could potentially fly. Much will also depend on the macro economic environment.