Date: Fri, Oct 31, 2025 | 08:40 AM GMT
The cryptocurrency market continues to experience high volatility, with both Bitcoin (BTC) and Ethereum (ETH) trading deep in the red. The move has triggered nearly $879 million in total liquidations , out of which $765 million came from long orders.
Following this broader market sell-off, Hyperliquid (HYPE) also saw a 10% drop today. However, its latest 1-hour chart structure now hints at a potential bullish reversal, aligning with a classic “Power of 3” pattern that could set the stage for a rebound if confirmed.
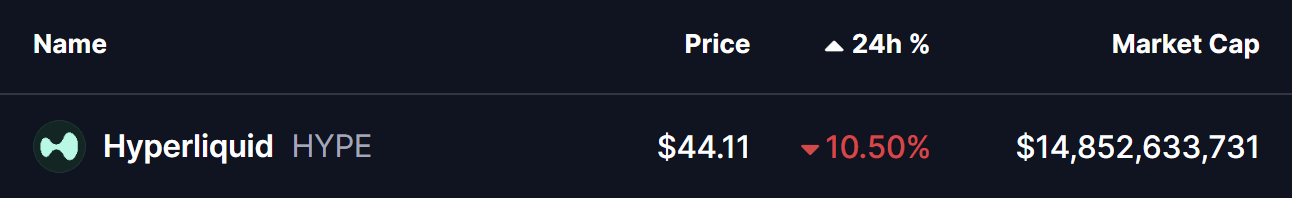 Source: Coinmarketcap
 Power of 3 Pattern in Play?
On the 1-hour chart, HYPE appears to be tracing out the Power of 3 formation — a structure that mirrors the three key stages of market behavior: accumulation, manipulation, and expansion.
Accumulation Phase
HYPE spent several sessions consolidating between $49.35 resistance and $46.00 support. This sideways action indicated a phase of accumulation, where stronger market participants quietly built positions while price remained stable and volatility stayed low.
Manipulation Phase
During the recent correction, HYPE broke below the $46.00 support, dipping to a low near $42.72 before quickly recovering to around $44.16. This move — highlighted by the red-shaded zone on the chart — likely represents the manipulation stage, where weaker hands are forced out via a false breakdown before the next leg higher begins.
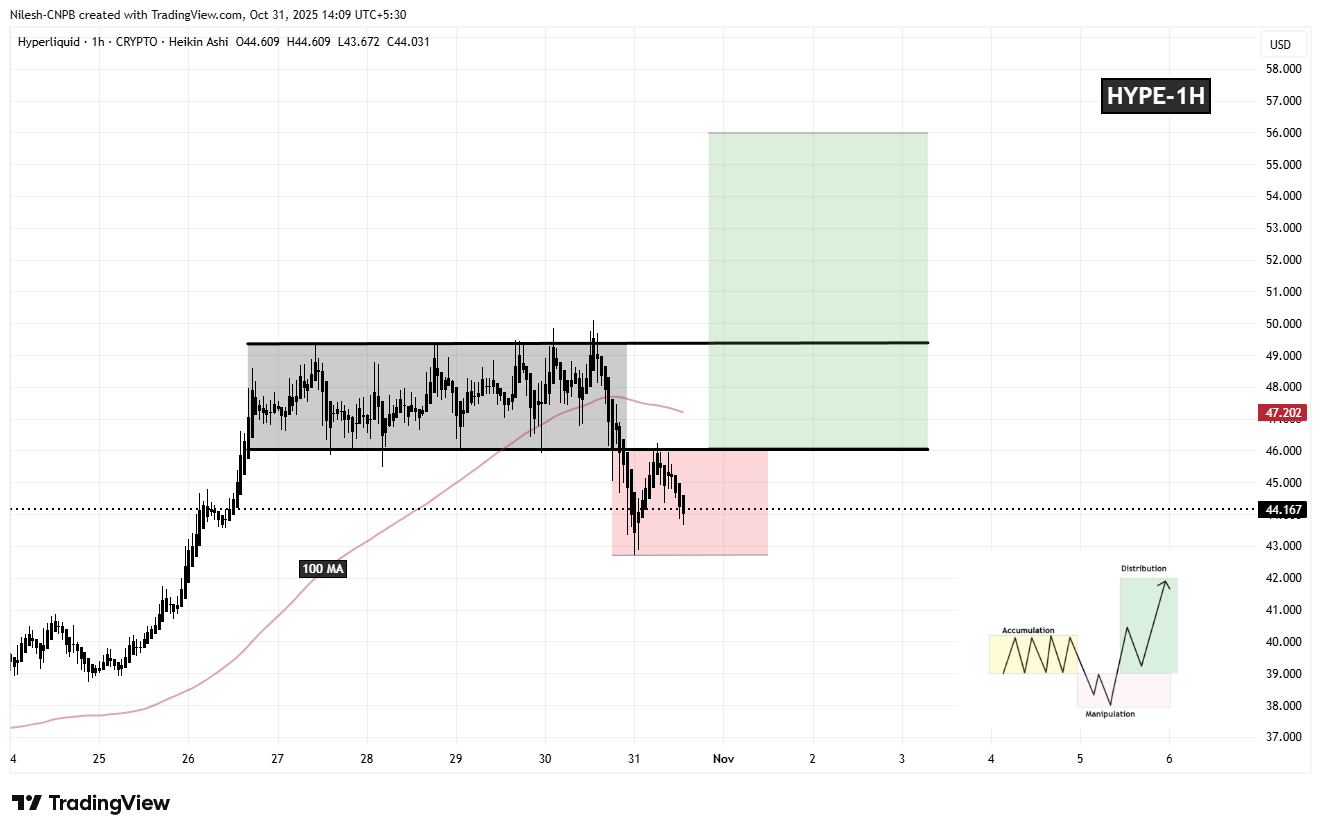 Hyperliquid (HYPE) 1H Chart/Coinsprobe (Source: Tradingview)
 What’s Next for HYPE?
At present, HYPE is still trading within the manipulation zone, suggesting that the market is testing sentiment before transitioning into the next phase.
If bulls manage to hold above $42.72 and reclaim the $46.00 range support, alongside breaking its 100-hour moving average (MA) near $47.20, the setup could shift into the expansion phase — historically the most powerful part of the cycle, marked by a rapid price surge.
A confirmed breakout and close above $49.35 would further validate the bullish reversal and open the door for an upside move toward $55.98, representing potential gains of around 26% from current levels.
However, if $42.72 fails to hold, the short-term outlook could weaken, potentially setting up a larger inverse Head and Shoulders pattern on the daily timeframe, which may require additional consolidation before any strong upward move resumes.