Bitcoin Price Reaches Make-or-Break Zone After October’s 3.5% Retreat
- Bitcoin price drives a mid-term sideways trend with an expanding channel pattern.
- BTC is back to the 0.85 cost-basis band near $109K, a region historically viewed as a critical pivot zone.
- October recorded one of the highest average order sizes in recent months, marking an uptick in whale-driven trades.
The pioneer cryptocurrency, Bitcoin, jumped nearly 1.5% on Friday to trade at $109,870. The buying pressure likely came as a relief rally after a notable sell-off earlier this week. A long rejection wick attached to the daily candle signals an intact overhead supply and a risk of further correction. While the downward trajectory must create concern among retail investors, the larger BTC holders are continuing to accumulate more coins, signaling their conviction for a bullish rebound in the near future.
Whales Step In as Bitcoin Price Tests $109K Floor After October Slide
October 2025 proved to be an unexpected outlier for investors, shattering the historic optimism often tied to this month. The Bitcoin price is on track to close October with a 3.5% loss, as the price currently trades at $109,476, and the market cap is at $2.18 trillion.
The price pullback can be attributed to several factors, including geopolitical trade war escalation, historical deleveraging of the crypto market on October 10th, technical breakdowns, and the recent hawkish turn by the Federal Reserve.
Following this correction, the Bitcoin price retested the 0.85 cost-basis band around $109K, a zone that has repeatedly acted as a make-or-break level. As shared analysis from Glassnode data indicates, the coin price could resume a bullish rally if this level holds. However, a bearish breakdown below this floor could bolster an extended correction to the 0.75 band around $98,000.
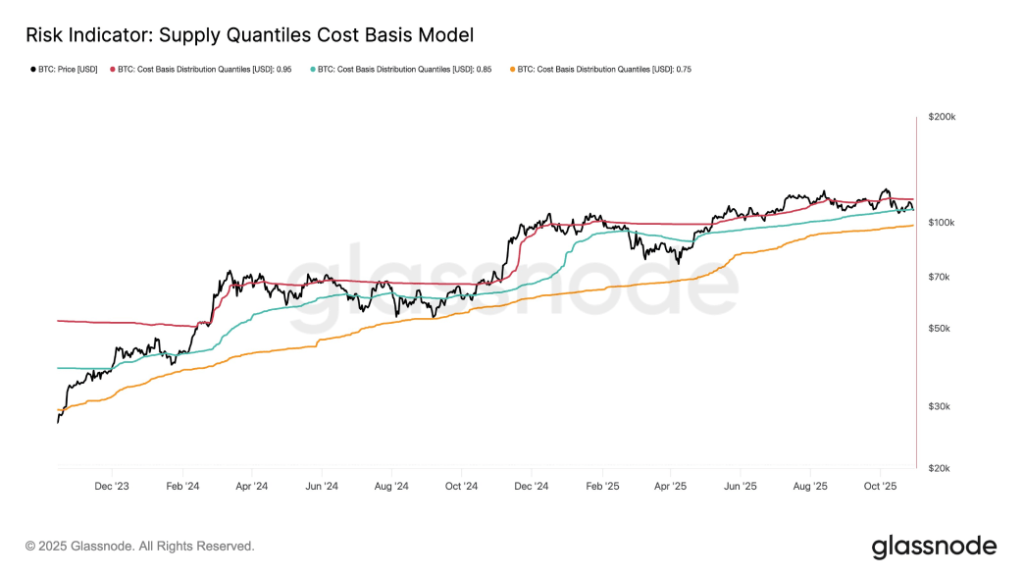
Bitcoin’s recent decline has pushed it back down to a key on-chain cost point of around $109,000—an area that has historically been the hallmark of major changes in its market cycle. Data collected by Glassnode has shown that this level belongs to the 0.85 cost-basis band, which has historically divided periods of solid recoveries from more severe corrections. There is a long history of the stock falling below the band and continuing to retrace down to the .75 level, which would be around $98,000.
Parallel market prices suggest increasing institutional participation throughout October. The average spot trade size of Bitcoin in the spot trade pairs on Binance increased dramatically to almost $1.96 million, as measured by a CryptoQuant analyst. This figure is one of the largest seen in recent months and indicates that high-cap investors have been taking more direct positions in the spot market.
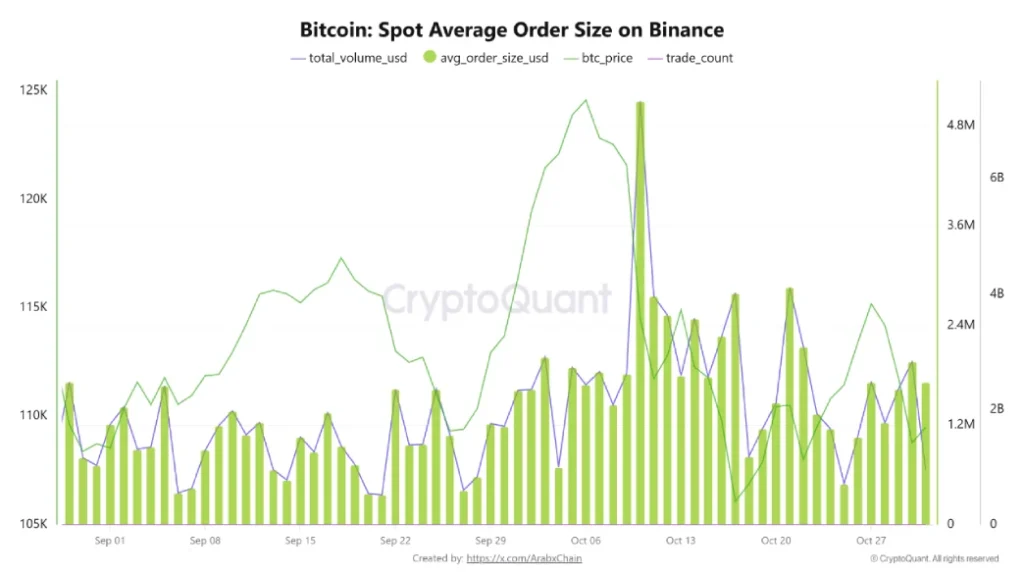
Binance also saw this institutional bias, with total Bitcoin spot trading volume reaching around $2.82 billion. The increase in both trade size and total flow means that larger entities have been active despite contained price volatility.
Bitcoin Price to Extend Correction Within Channel Pattern
This week, the Bitcoin price shows a notable reversal from $116,381 to a current trading price of $109,502, registering a loss of 5.91%. This pullback, backed by increasing length of red candles and rising trading volume, accentuates the conviction from sellers to drive a prolonged correction. Even the green candle today shows an 8.86% decline in trading volume, accentuating the weak hands from buyers.
Currently, the BTC price challenges the support of the 200-day exponential moving average, with a potential breakdown looming. If materialized, the selling pressure would accelerate and push the price down by another 5.3% to test the bottom trendline of an expanding channel valued at $102,560.
Theoretically, the chart pattern is characterized by two diverging trendlines, which create a higher swing in price each cycle, reflecting market uncertainty. A potential breakdown below this level would further intensify the bearish correction in price below the $100k level.
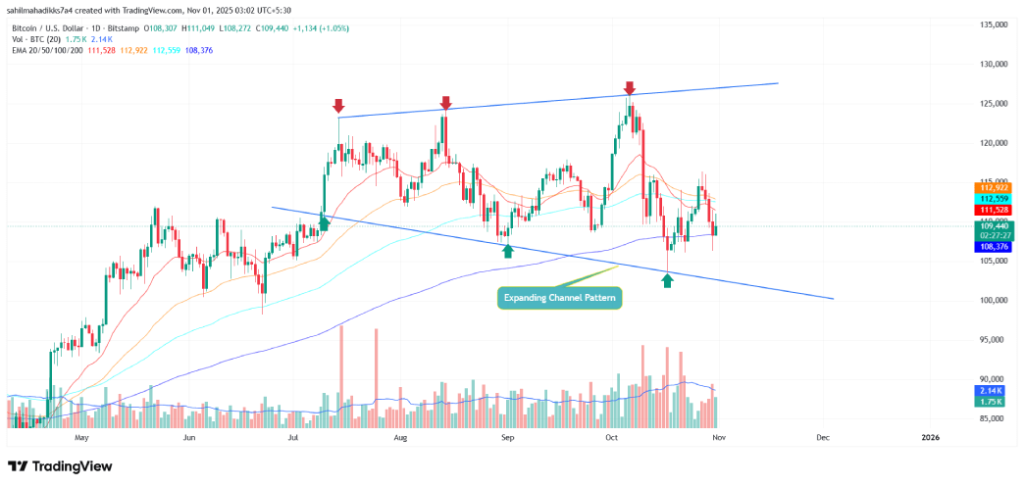
On the contrary, if the buyers manage to hold their support, the Bitcoin price could rebound for a potential renewed recovery.