Date: Mon, Nov 03, 2025 | 06:05 AM GMT
The cryptocurrency market is shading its weekend upside momentum as both Bitcoin (BTC) and Ethereum (ETH) slip by 2% and 3% respectively, adding significant pressure on major altcoins — including Stellar (XLM).
XLM has dropped around 4% today, but more importantly, it’s now hovering at a crucial support level, one that could determine whether a short-term rebound or further downside is next.
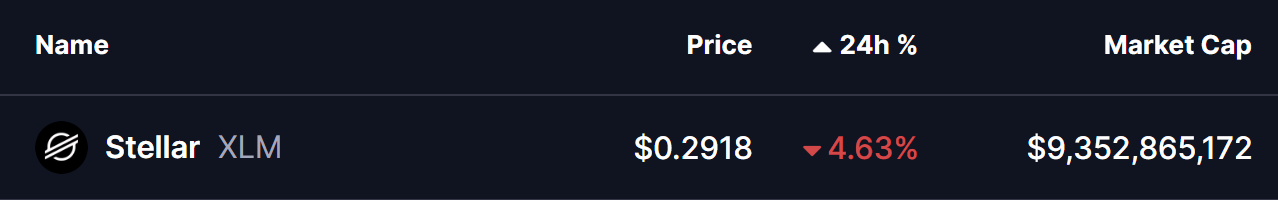 Source: Coinmarketcap
 Descending Triangle in Play
On the 4-hour chart, XLM has been consolidating within a descending triangle pattern — a technical structure often associated with price compression and uncertainty. While traditionally viewed as bearish, descending triangles can sometimes lead to sharp countertrend rebounds before any decisive breakdown occurs.
The recent drop from around $0.3080 has once again brought XLM near the lower boundary of the triangle, where it’s testing a crucial support zone around $0.29–$0.2950. This level has previously acted as a strong demand area, with buyers repeatedly stepping in to defend it and prevent deeper declines.
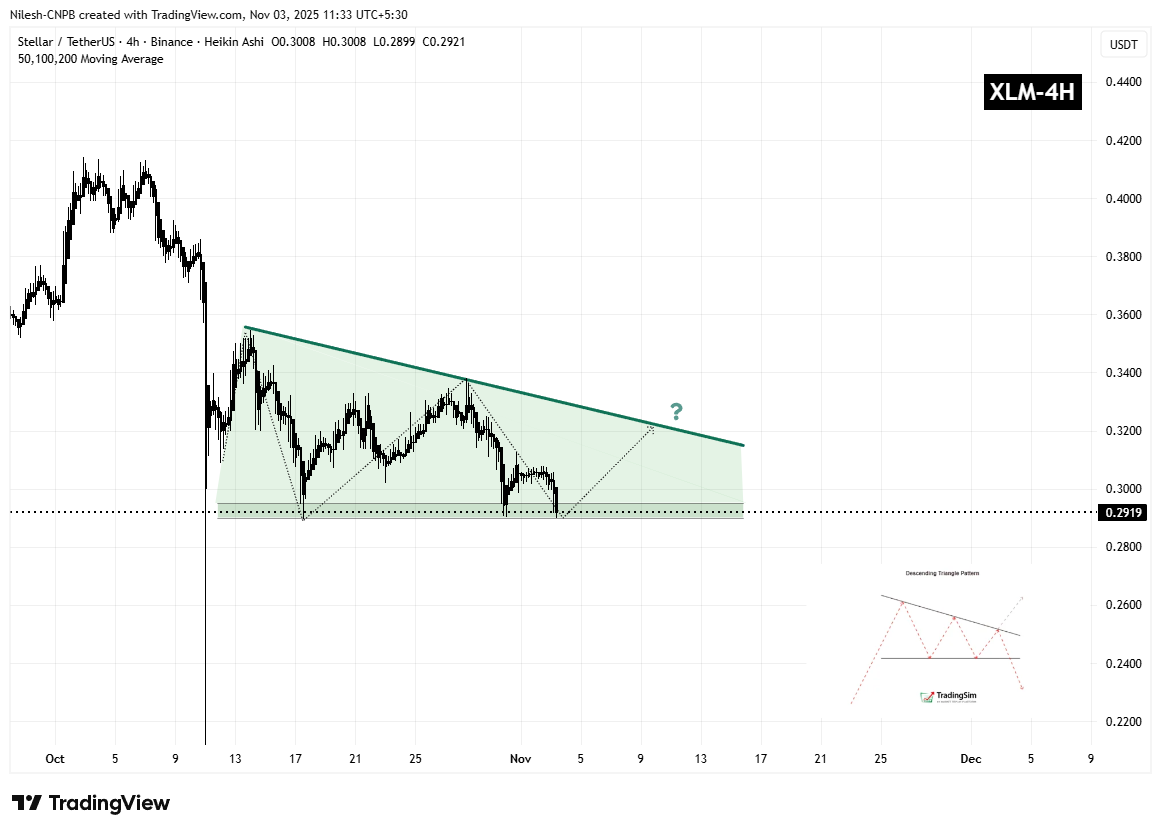 Stellar (XLM) 4H Chart/Coinsprobe (Source: Tradingview)
 The pattern shows that each attempt to break below this zone has been met with quick buying reactions, highlighting the importance of this range as a potential make-or-break area for bulls hoping to maintain the broader structure.
What’s Next for XLM?
If bulls manage to defend this support range and push the price back above $0.3052, momentum could quickly shift. In that case, XLM might retest the descending trendline resistance near $0.3216. A clean breakout above this line could unlock higher targets, while failure may lead to another pullback into the support zone.
On the downside, a break below $0.29 would invalidate the support base and likely open the door for a deeper correction.