The cryptocurrency market has declined substantially over the past 24 hours, as its rough start to November continues. Major cryptocurrencies, including Bitcoin (BTC) , traded deep in the red, with some altcoins registering double-digit declines over the past 24 hours.
Liquidations are also piling up, with $1.16 billion worth of positions wiped out. The majority of positions liquidated were long positions, indicating traders expected prices to rise.
BTC traded above $108,000 on Monday as the markets started the week in the red. However, selling pressure intensified on Tuesday, driving the flagship cryptocurrency lower. As a result, BTC plunged below $105,000, down over 3%, trading around $104,043. Ethereum (ETH) has registered a bigger decline over the past 24 hours, down over 6%, trading around $3,491. Ripple (XRP) is also down over 6%, while Solana (SOL) is down 9%, trading around $159. Dogecoin (DOGE) fell 5% to $0.164 while Cardano (ADA) is down 6.36%, trading around $0.541. Chainlink (LINK) , Stellar (XLM) , Hedera (HBAR) , Litecoin (LTC) , Toncoin (TON) , and Polkadot (DOT) also registered substantial declines over the past 24 hours.
Bitcoin (BTC), Ethereum (ETH), And Altcoins Plunge As Liquidations Mount
After ending “Uptober” in the red, Bitcoin (BTC) and other cryptocurrencies continued bleeding in November as prices tanked. BTC is down nearly 4% over the past 24 hours, while Ethereum (ETH) fell over 6% as it struggles to reclaim the $3,500 mark. Liquidations are piling up, with over $1.16 billion worth of positions wiped out over the past 24 hours, according to data from CoinGlass. Out of this, $1.08 billion were long positions. BTC saw around $298 million in long positions wiped out, while ETH registered $273 million worth of liquidations.
The cryptocurrency market’s latest decline came as the Nasdaq and S&P 500 traded in positive territory, with no obvious catalyst behind the dramatic decline. However, pseudo-anonymous analyst Maartunn explained, stating that sell pressure from spot Bitcoin traders and “signs of fragility” in Ethereum charts could have spooked traders. The analyst stated,
“During strong bullish phases, you often don’t get a retest of a support level because it gets front-run. In more bearish periods, however, such retests are more likely. Multiple tests of the same support level are not a bullish sign. It’s hard to put an exact number on it, but at some point, new buyers simply get exhausted.”
Market Seeks Stability After October Disarray
The October market crash drained leverage and risk capital from crypto. According to Rachel Lin, chief executive at SynFutures, October’s correction has flushed out leverage and recent market sentiment. Lin highlighted on-chain data, which showed that long-term holders were not capitulating.
“In many ways, October’s correction has done what it needed to: it has flushed out leverage and reset sentiment. On-chain data shows that long-term holders are not capitulating; they’re actively accumulating. Exchange outflows remain steady, and that’s historically a constructive sign.”
Lin added that November could start in the red as markets digest Fed Chair Jerome Powell’s comments.
Why Is Crypto In The Red?
The cryptocurrency market is going through one of its most difficult phases in recent memory. BTC and other cryptocurrencies have registered heavy declines this week as bearish sentiment dominates the market. Crypto trader and analyst Michaël van de Poppe explained that a possible reason behind the steep decline could be limited tradable supply. According to van de Poppe, if the tradable supply is limited, any large sell order could impact the market. The analyst stated,
“For example, if someone decides to sell just 2% of the total supply, it can cause a big drop because the order books can’t absorb that much selling pressure, especially in a market where most traders have already been liquidated in recent weeks. If you’re holding altcoins, be patient,” van de Poppe says. “The cycle hasn’t peaked yet.”
Bitcoin (BTC) Price Analysis
Bitcoin (BTC) extended its losses for a second day as it fell below key levels on its way to an intraday low of $103,571. After experiencing its worst October since 2018, BTC registered a marginal recovery over the weekend, rising 1.15% on Friday and 0.45% on Saturday to reclaim $110,000 and settle at $110,045. Despite trading in positive territory on Sunday, traders were unsure of BTC’s recovery. Sure enough, the flagship cryptocurrency plunged nearly 4% on Monday as the week started in the red. BTC is down almost 3% during the current session, trading around $103,764.
BTC’s price action gave traders a sense of deja vu as its weekend gains were wiped out on Monday. Analysts believe BTC could face one of its most difficult weeks of Q4 as prices retest range lows. CrypNeuvo stated in a post on X,
“In all honesty, it looks like this could be one of the most difficult trading weeks of Q4. That makes me think we might be in a range-bound environment; therefore, I should be aware of a potential range low retest.”
The trader noted that the range lows had key confluence with BTC’s 50-week exponential moving average at around $101,150, increasing the odds of a bottom target.
“It’s a very solid support, so we would see a very aggressive bounce from there.”
Meanwhile, trader Daan Crypto Trades highlighted exchange order-book liquidity for key price targets.
"Two big liquidity levels had built up in the short term during the weekend range. Price took out the lower bound that was sitting at $108,500. There's still a decent cluster around $112,000. When zooming out, the $105,000-$106,000and $117,000 levels are worth looking at.”
Meanwhile, the crypto market sentiment nosedived on Tuesday as BTC fell below $105,000. The Crypto Fear & Greed Index dropped to a score of 21 out of 100, indicating “Extreme Fear.” The sentiment fell to its lowest in nearly 7 months. The index has swung between Extreme Fear and Neutral since the October 10 market crash. Analysts have attributed BTC’s latest dip to reduced institutional demand and blockchain activity. The Federal Reserve’s hawkish stance has also impacted market sentiment. The Fed signaled that the recent rate cut could be the last in 2025, dashing hopes of another rate cut in December.
BTC started the previous weekend on a bullish note, rising 0.84% on Friday and 0.56% on Saturday to settle at $111,666. Bullish sentiment intensified on Sunday as the flagship cryptocurrency rose nearly 3% to cross $114,000 and settle at $114,548. BTC reached an intraday high of $116,410 on Monday. However, it lost momentum after reaching this level and settled at $114,087, ultimately dropping 0.40%. Selling pressure and volatility persisted on Tuesday as the price fell 1.03% to $112,906. Bearish sentiment intensified on Wednesday as BTC fell 2.55% and settled at $110.032.
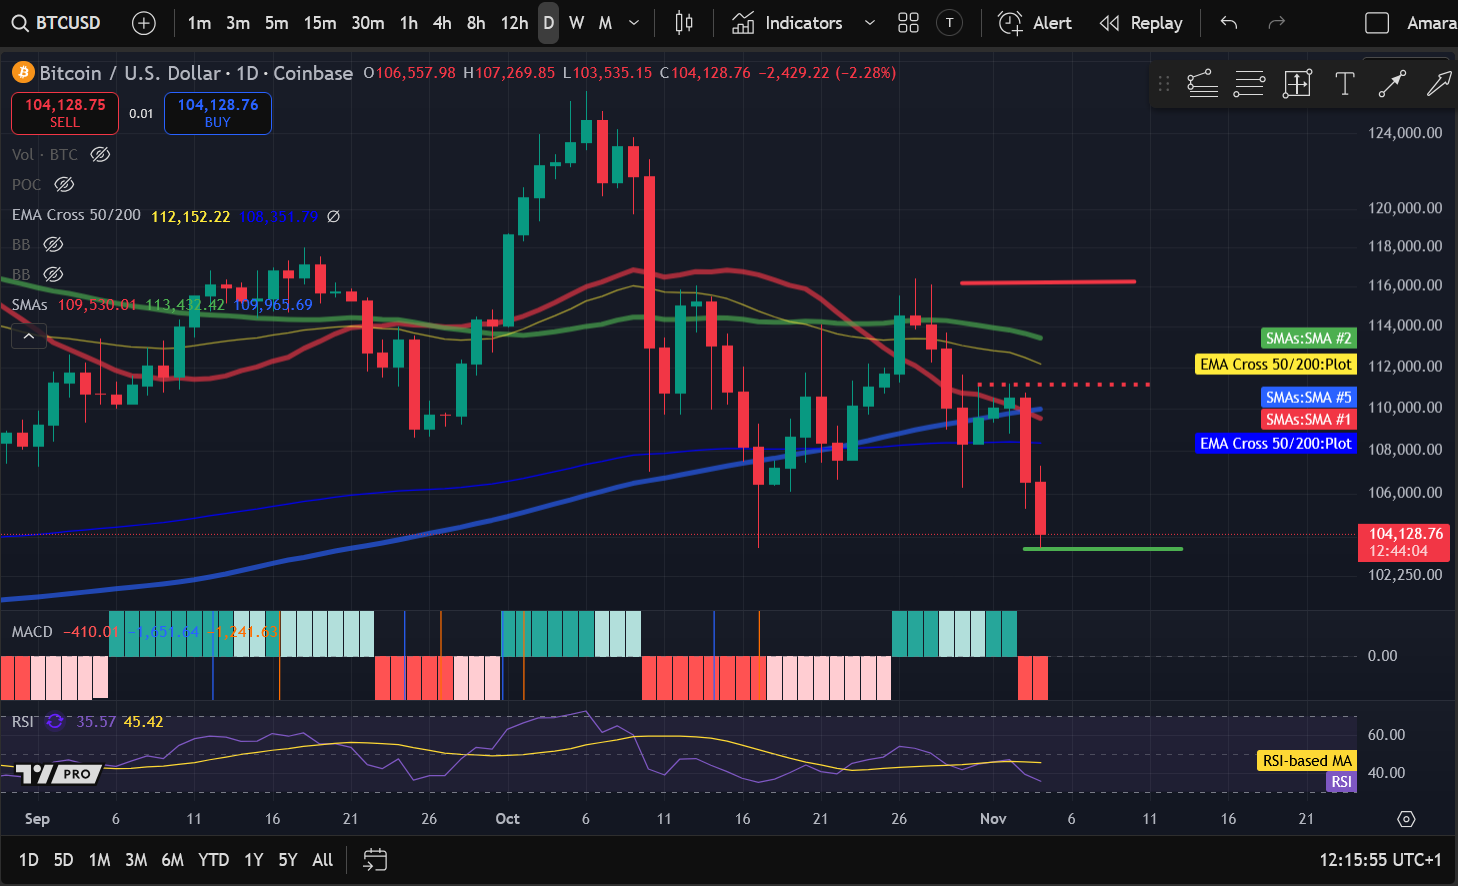
Source: TradingView
Volatility and selling pressure persisted on Thursday as BTC reached an intraday high of $111,629, fell to an intraday low of $106,279, and settled at $108,308. Despite the overwhelming selling pressure, BTC returned to positive territory on Friday, rising 1.15% and settling at $108,555. Price action remained positive over the weekend, with BTC increasing 0.45% on Saturday and 0.44% on Sunday to settle at $110,536. Bearish sentiment intensified on Monday as BTC fell nearly 4% and settled at $106,557. The flagship cryptocurrency is down almost 3% during the ongoing session, trading around $104,100.
Ethereum (ETH) Price Analysis
Ethereum (ETH) fell below $$3,500 for the first time since October’s market crash, falling to a low of $3,461 during the ongoing session. The world’s second-largest cryptocurrency registered a notable increase over the weekend, rising 1.14% on Saturday and 0.67% on Sunday to settle at $3,374. The price rose 0.87% on Sunday to reclaim $3,900 and settle at $3,908. However, ETH’s recovery fizzled out on Monday as it fell nearly 8% to $3,604. The altcoin is down almost 3% during the ongoing session, trading around $3,519.
ETH’s decline has dragged several Ethereum treasury companies into the red. BitMine Immersion and Sharplink, two of the largest Ethereum treasury companies, are sitting on substantial unrealized losses as of Tuesday. The two firms hold 4,172,922 ETH worth over $14.5 billion between them. The firms went on an acquisition spree in 2025, with BitMine paying around $4,037 per coin, while Sharplink paid around $3,609 per coin. According to data from CoinGecko, several other firms are also sitting on heavy unrealized losses.
Fundamental Global is sitting on the largest unrealized losses after purchasing the token for an average price of $4,228 per coin. The Ether Machine and Quantum Solutions are also in the red. However, Bit Digital and GameSquare, which bought their ETH below $3,000 per coin, have some room to navigate.
However, the companies plan to buy the dip, indicating they are willing to stick with their strategy. Despite sitting on paper losses, BitMine doubled down on its strategy, purchasing $300 million in ETH during the week starting November 3.
ETH started the previous weekend in positive territory, rising over 2% on Friday and settling at $3,935. The price rose 0.45% on Saturday, rallying 5% on Sunday to cross $4,000, settling at $4,157. ETH reached an intraday high of $4,266 on Monday. However, it lost momentum after reaching this level and dropped 0.87% to $4,120. Selling pressure intensified on Tuesday as the price fell 3.37%, slipping below $4,000 to $3,982. Sellers retained control on Wednesday as ETH dropped 1.92% and settled at $3,905.
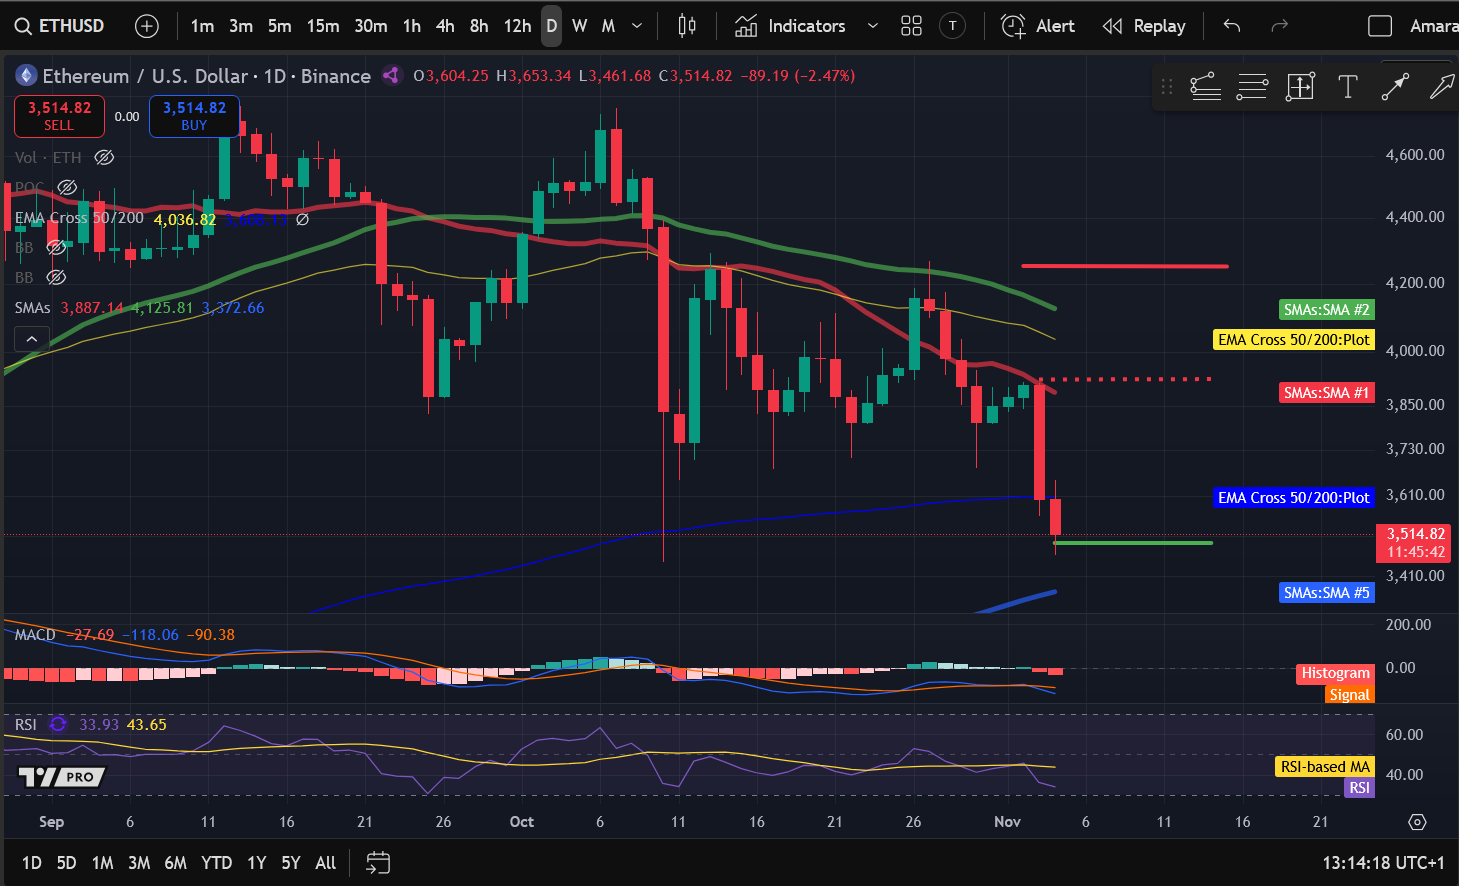
Source: TradingView
Bearish sentiment intensified on Thursday as ETH fell nearly 3% to a low of $3,682 before reclaiming $3,800 and settling at $3,805. Despite the overwhelming selling pressure, the price recovered on Friday, rising 1.14% to $3,848. Price action remained positive over the weekend, with ETH increasing 0.67% on Saturday and 0.87% on Sunday to settle at $3,908. Bearish sentiment returned on Monday as ETH plunged nearly 8% and settled at $3,604. Sellers have retained control during the ongoing session, with the price down almost 3% at $3,512.
Solana (SOL) Price Analysis
Solana (SOL) fell to a low of $155 during the ongoing session, extending its decline for a second day. The altcoin ended the weekend in positive territory, rising 0.76% to $187. However, it lost momentum on Monday as bearish sentiment returned. As a result, SOL plunged nearly 12% and settled at $166. The price is down almost 3% during the current session, trading around $161.
SOL is down nearly 20% over the past week despite the debut of Solana ETFs on the market. SOL ETFs have been a huge success, drawing $421 million in investments. Bitwise’s BSOL dominated the inflows, registering $199 million in new investments, making it the top-performing crypto ETF of the week, even surpassing BlackRock’s iShares Bitcoin Trust (IBIT). K33 Head of Research Vetle Lunde called Solana ETFs a “clear success,” stating,
“The launch of US spot Solana ETFs has been a clear success, drawing strong investor demand despite broader crypto fund outflows.”
While BSOL performed admirably, Grayscale’s Solana Trust (GSOL) lagged, registering only $2.2 million in inflows. It entered the market with $102 million in assets under management after converting from a closed-end fund. GSOL charges a 0.35% management fee, significantly lower than its 1.5% fee on GBTC and ETHE. However, Bitwise undercut that, offering a 0.20% fee on BSOL, a move that analysts believe boosted its appeal among investors. Lunde added,
“BSOL’s lower fees and first-mover advantage have fueled its rapid growth. GSOL’s higher costs and later entry have tempered investor appetite.”
Solana (SOL) rose 1.18% on Friday (October 24) and settled at $193. Price action remained positive over the weekend as SOL registered a marginal increase on Saturday before rallying over 3% on Sunday to reclaim $200. The altcoin reached an intraday high of $205 on Monday as bullish sentiment intensified. However, it lost momentum after reaching this level and fell 0.65% to $198. Sellers retained control on Tuesday as the price dropped by over 2% and settled at $194. SOL faced volatility on Wednesday as buyers and sellers struggled to establish control. Sellers ultimately gained the upper hand as the price registered a marginal decline.
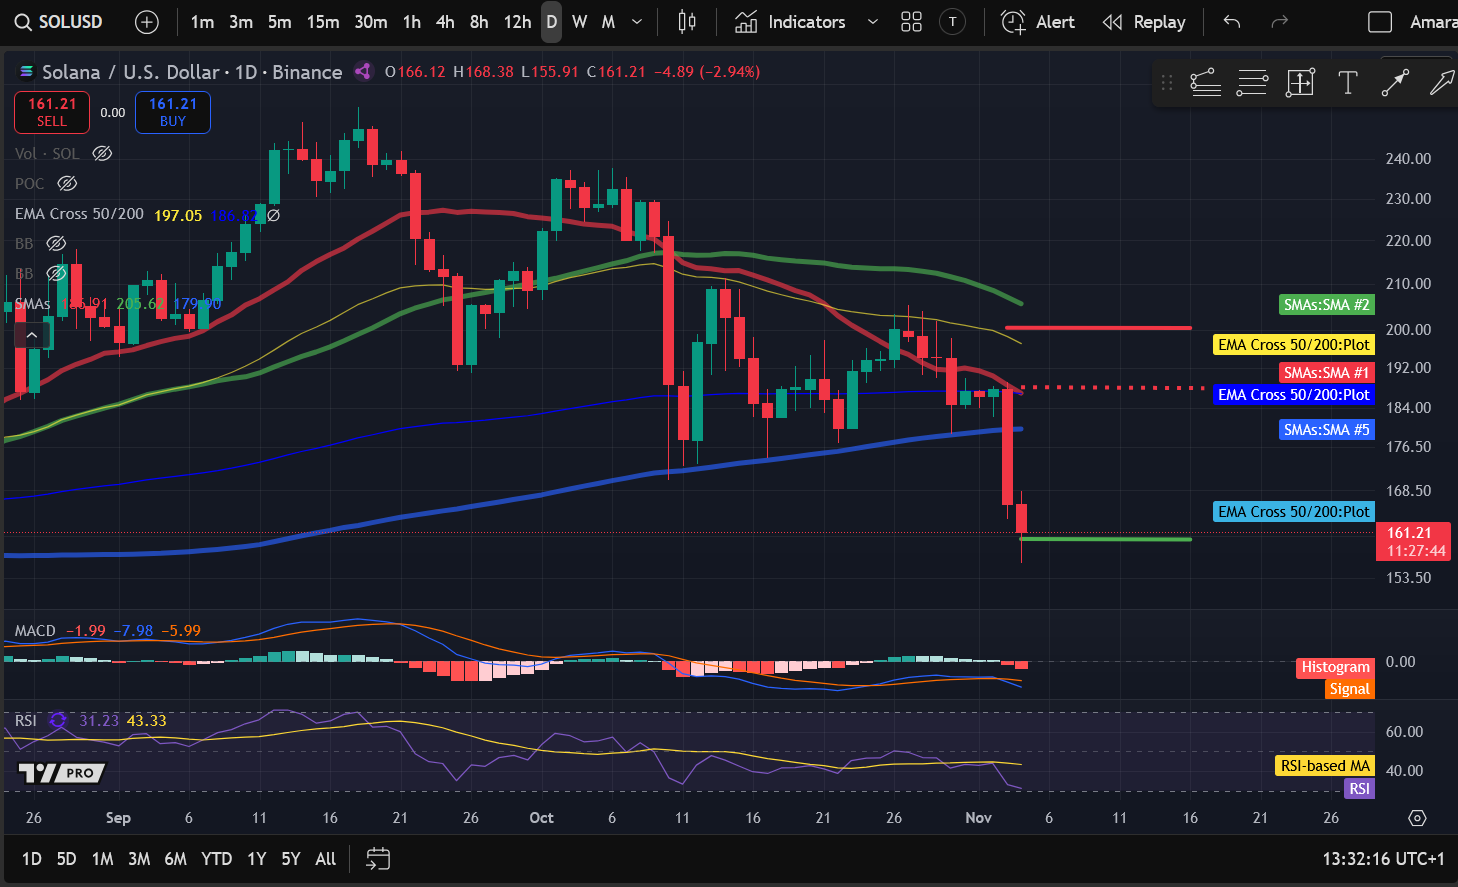
Source: TradingView
Bearish sentiment intensified on Thursday as SOL fell nearly 5% and settled at $184. Despite the overwhelming selling pressure, the price recovered on Friday, rising 1.34% and settling at $187. Price action was mixed over the weekend as SOL registered a marginal drop on Saturday before rising 0.76% on Sunday and settling at $187. Bearish sentiment intensified on Monday as SOL plunged nearly 12% to $166. Sellers have retained control during the ongoing session, with the price down almost 3% at $161.
Bittensor (TAO) Price Analysis
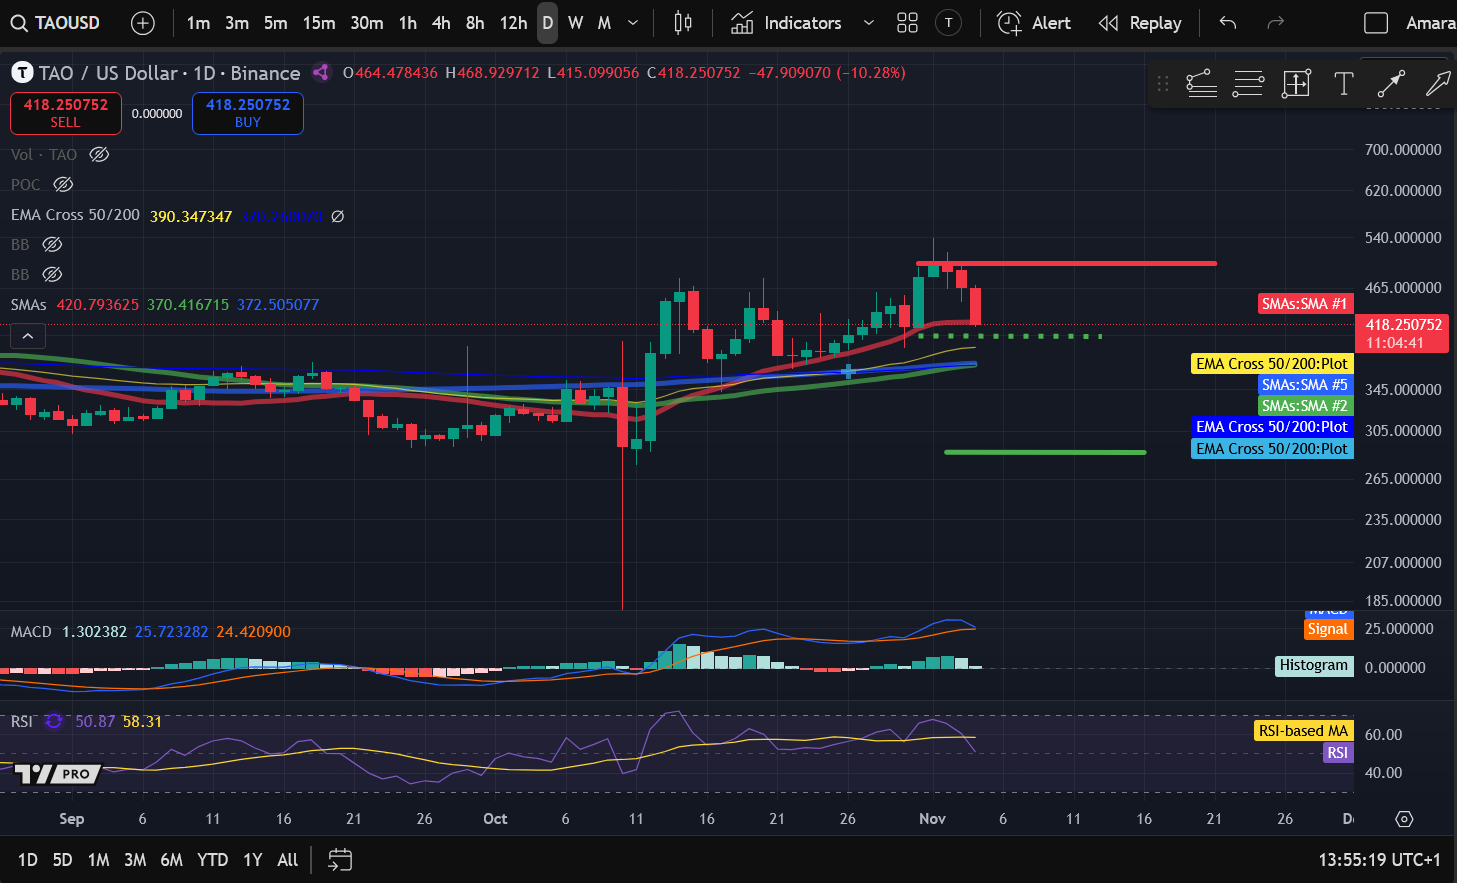
Bittensor (TAO) started the previous weekend in the red, registering a marginal decline on Friday and settling at $385. Price action was positive on Saturday and Sunday as the price rose 2.79% and 2.24% to cross $400 and settle at $404. The price continued pushing higher on Monday, rising 2.51% to $414. Bullish sentiment intensified on Tuesday as TAO rose over 4% and settled at $432, but not before reaching an intraday high of $459. Buyers retained control on Wednesday as the price rose 2% to $441.
Source: TradingView
Despite the positive sentiment, TAO was back in the red on Thursday, dropping nearly 6% to $415. Bullish sentiment returned on Friday as the price rallied, rising almost 16% to cross $450 and settle at $481. Price action was mixed over the weekend, as TAO rose 3.42% on Saturday and 1.72% on Sunday to settle at $488. Sellers retained control on Monday as TAO fell 4.66% to $466. Selling pressure has intensified during the ongoing session, with the price down over 10% at $418.
Jupiter (JUP) Price Analysis
Jupiter (JUP) started the previous weekend in bullish territory, rising 12.70% and settling at $0.402. Price action was positive on Saturday and Sunday, increasing 6.12% and 1.64% to $0.434. Buyers retained control on Monday as the price rose 2.28% and settled at $0.444. Despite the positive sentiment, JUP lost momentum on Tuesday and fell over 3% to $0.347. Sellers retained control on Wednesday as the price fell over 3% and settled at $0.417.
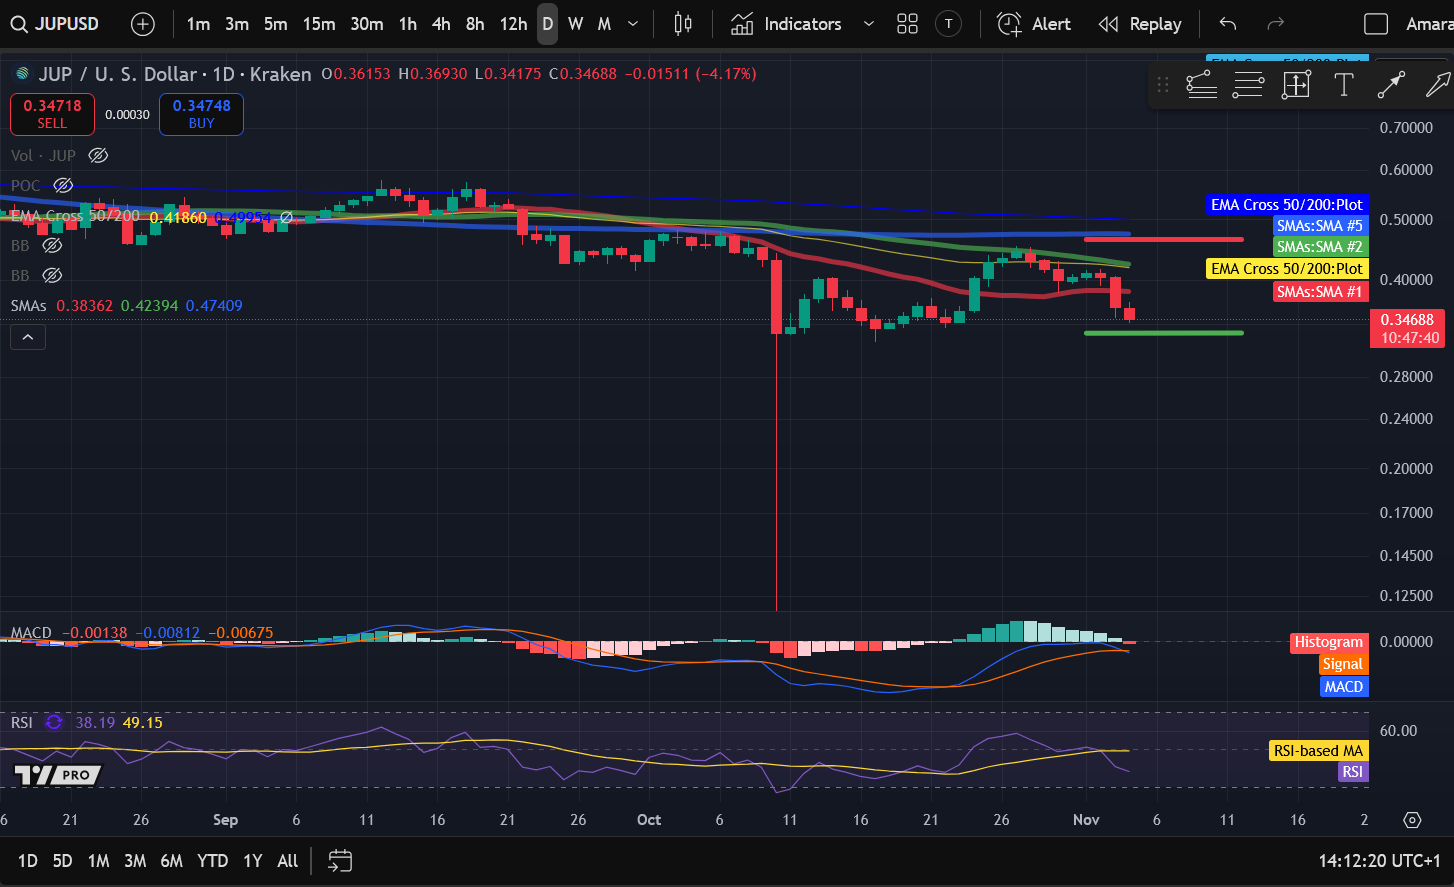
Source: TradingView
Selling pressure intensified on Thursday as JUP fell over 4% to $0.400. The price recovered on Friday, rising 1.24% to $0.405. Price action was mixed over the weekend as JUP rose 1.45% on Saturday and 1.64% on Sunday to settle at $0.404. Bearish sentiment intensified on Monday as the price fell over 10% to $0.361. JUP is down nearly 4% during the ongoing session, trading around $0.346.