Date: Wed, Nov 05, 2025 | 12:45 PM GMT
The cryptocurrency market is showing minor signs of relief after a sharp sell-off over the past two days that pushed Bitcoin (BTC) down to the $98K region before rebounding to around $102K and now it’s technical structure is hinting at the possibility of a short-term rebound as it continues to hold a crucial support zone that has repeatedly acted as a floor during recent corrections.
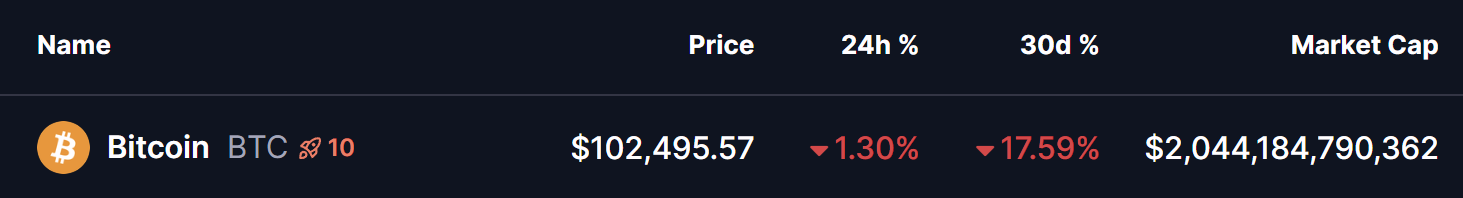 Source: Coinmarketcap
 Symmetrical Descending Broadening Wedge in Play
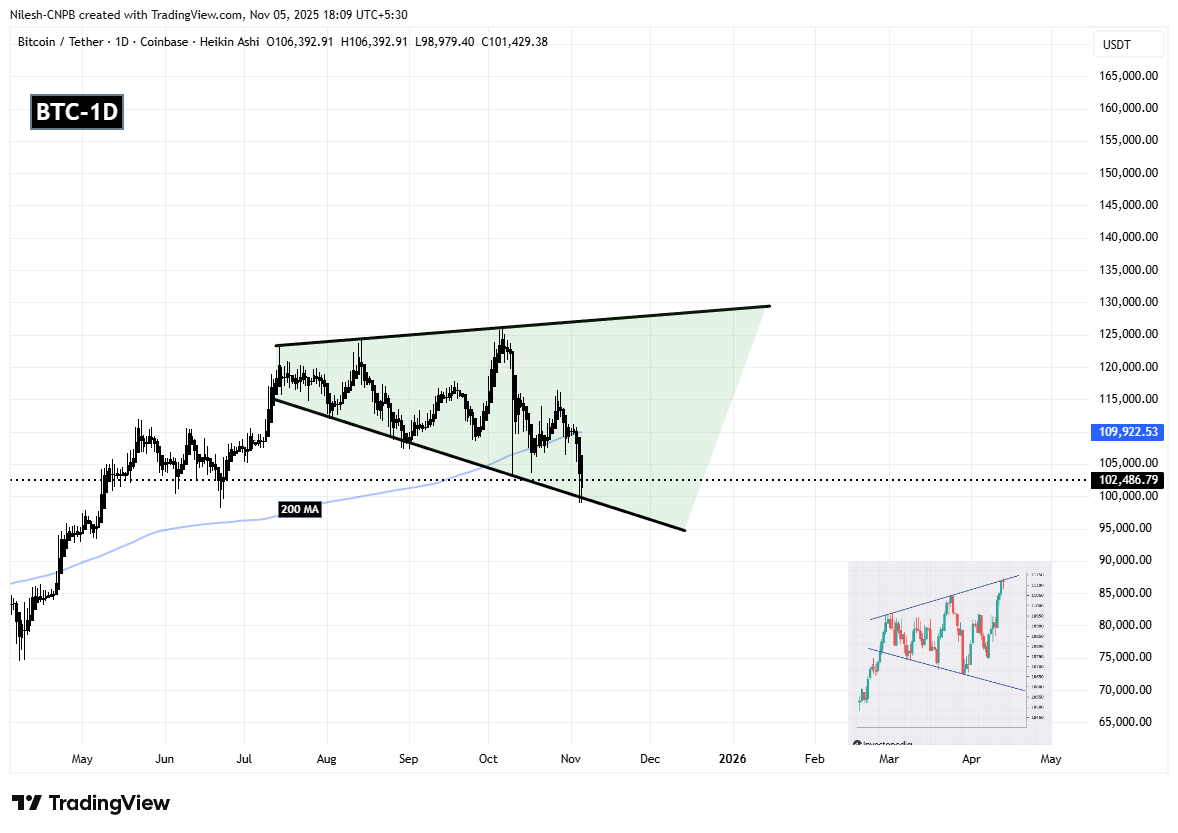
On the daily chart, BTC continues to trade within a symmetrical descending broadening wedge — a bullish reversal pattern that often forms during corrective downtrends, signaling a potential volatility expansion phase before a breakout.
In the latest correction, BTC faced rejection near the wedge’s upper boundary around $126K, which triggered a sharp pullback toward the lower trendline near $98K. Encouragingly, buyers have once again stepped in at this level, with the price now holding above $102K, hovering just above the wedge’s lower support area.
 BTC Daily Chart/Coinsprobe (Source: Tradingview)
 This region has served as a dynamic support on multiple occasions, indicating that bulls continue to defend it aggressively to preserve the broader bullish setup. The pattern’s structure suggests that as long as BTC maintains support above the lower boundary, the potential for a rebound remains strong.
What’s Next for BTC?
If buyers successfully defend the lower wedge boundary, BTC could build enough short-term momentum for a rebound toward the wedge’s upper resistance near $128K. A decisive breakout above this resistance zone would confirm a bullish continuation, potentially setting the stage for a stronger recovery phase in the days ahead.
However, a break below the lower trendline would invalidate the bullish pattern and could open the door to deeper losses, as sellers regain control. In that case, traders may look for the next key support levels around the mid-$90K region.
For now, BTC’s chart structure remains cautiously optimistic — the symmetrical descending broadening wedge continues to hold firm, and the recent bounce from the $98K zone shows that buyers are not yet ready to give up control. If overall sentiment stabilizes, Bitcoin could soon attempt a stronger upward move out of this corrective phase.