Key Notes
- 21Shares drove aggregate outflows with $34 million in redemptions while Bitwise and Grayscale continued accumulating positions.
- Most ETF holders remain underwater with average cost basis near $151, reducing likelihood of mass liquidations at current levels.
- Technical resistance at the 20-day moving average ($152) must be cleared before SOL can target the $168 level.
On Nov. 27, Solana SOL $142.0 24h volatility: 0.9% Market cap: $79.19 B Vol. 24h: $4.68 B price reclaimed the $140 threshold for the first time since mid-month. The rebound arrived alongside a notable shift in ETF flows, as Solana ETFs logged $8.2 million in net withdrawals, the first negative session since launch.
ETF issuers recorded their first outflow day after a 22-day inflow streak. The day’s numbers were led by 21Shares, which saw $34 million in outflows, while Bitwise extended its accumulation with a $13.3 million addition. Fidelity’s FSOL added $2.5 million, Grayscale’s GSOL attracted $10.4 million, and VanEck reported neutral flows. The 21Shares outflow was large enough to push aggregate flows negative for the first time since SEC approval on Oct. 28.
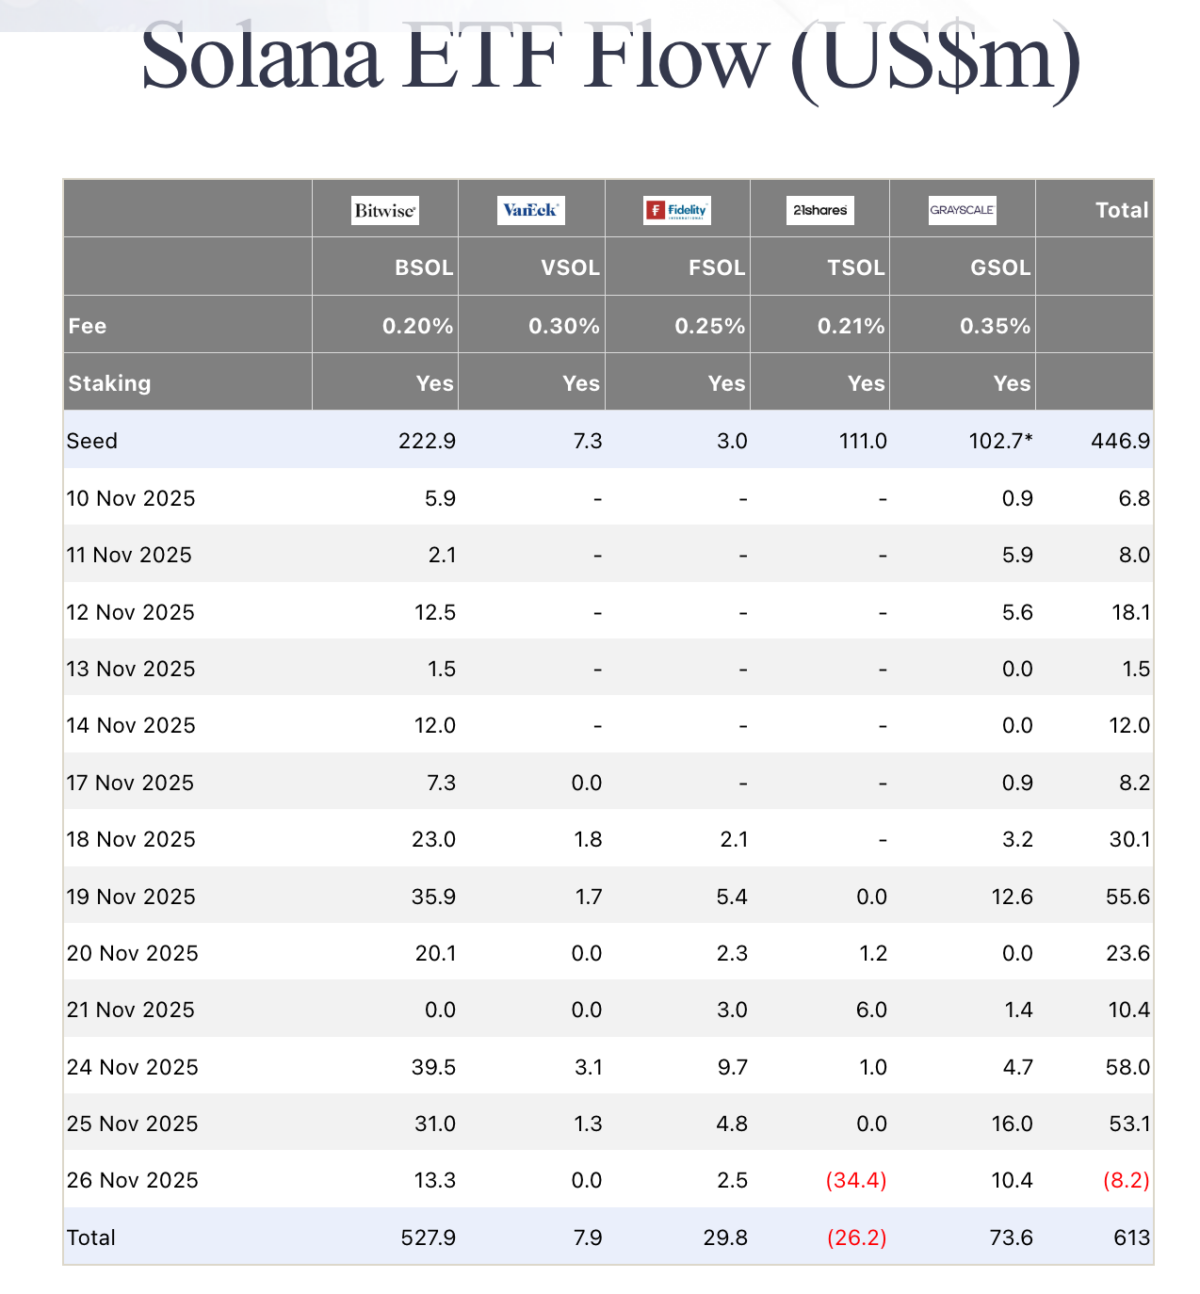
21Share (TSOL) $33.4 million outflows plunges Solana ETFs into first-day of outflows since launch | Source: FarsideInvestors
Solana ETFs have largely opted to sit on their holdings while Bitcoin BTC $91 457 24h volatility: 1.4% Market cap: $1.82 T Vol. 24h: $68.45 B and Ethereum ETH $3 025 24h volatility: 0.3% Market cap: $364.58 B Vol. 24h: $18.16 B issuers saw more aggressive adjustments. The preference stems partly from the SEC’s approval of staking for Solana ETFs, resulting in a yield-driven incentive to hold through volatility.
The latest outflow could put traders on alert for a potential profit-taking phase from ETF holders. However, an accelerated sell-off appears unlikely at current price levels. Solana traded near $200 when ETF approval was announced on Oct. 28 and has maintained a 30-day average of $151, according to TradingView data.
With SOL trading at $141 at press time, most ETF holders remain underwater and may be unlikely to sell large portions of their holdings at a loss. However, sell-signals could emerge as SOL approaches the $150 level, the average cost basis of active Solana ETF.
Solana Price Forecast: Can SOL Break Above the 20-Day MA?
Solana enters the final stretch of the month with improving momentum, but the technical indicators suggest the rebound prospects remain weak. The daily chart shows SOL trading below all three short-term moving averages, at $142, $152 and $168, reinforcing a cautious outlook until stronger confirmation emerges.
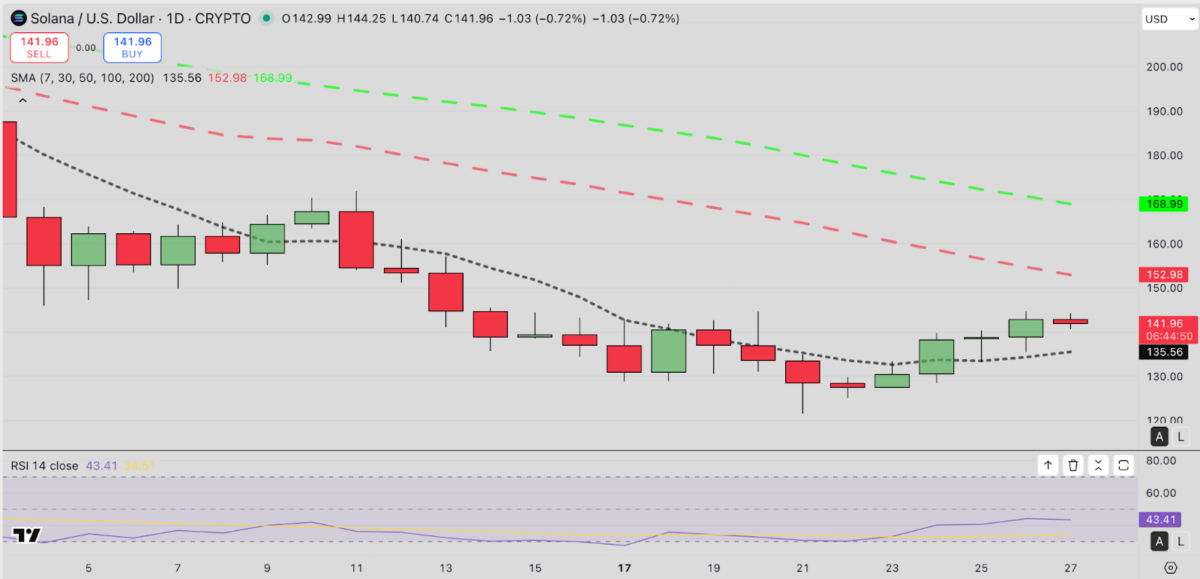
Solana (SOL) price forecast, Nov. 27 | TradingView
Solana’s RSI has also recovered from oversold territory and continues to trend upward, but remains below the 50-line, signaling weak momentum.
While the 7-day SMA at $142 poses immediate intraday resistance, a decisive close above the 20-day MA at $152 could open the door to a retest of $168, near the 50-day MA. However, failure to clear the 20-day MA may trigger a pullback toward $135, the zone that previously acted as short-term support.
Crypto Traders Monitor Meme Coin Leverage Trends
Meme Coin Leverage Trends