Bitcoin is currently trading below key support levels, with analysts predicting potential declines toward $100K if it fails to hold above $111,877. A recovery above $120K could signal a bullish reversal.
-
Bitcoin trades at $115,454 after breaking wedge support, with $111,877 identified as immediate support on the daily chart.
-
Analysts warn of downside toward $100K if $111,877 fails, with extended targets between $95,000 and $92,000.
-
Recovery above $118K–$120K could lift Bitcoin back toward $124K–$127K, with breakout potential toward $135K.
Bitcoin price analysis reveals critical support and resistance levels, urging traders to monitor key price points for potential market shifts.
What is Bitcoin’s Current Price Trend?
Bitcoin is experiencing renewed technical pressure as it trades below significant support levels. Currently, the primary keyword for traders is the immediate support at $111,877, with analysts closely watching for potential declines.
What is a Rising Wedge Pattern?
A rising wedge pattern typically forms when prices move within converging upward-sloping lines, indicating weakening momentum. This setup often precedes corrective phases, raising concerns among traders about Bitcoin’s current trajectory.
Frequently Asked Questions
What happens if Bitcoin falls below $111,877?
If Bitcoin falls below $111,877, it could signal a deeper retracement, with targets potentially reaching $100,000 and lower levels around $95,000 to $92,000.
How can Bitcoin recover from its current position?
Bitcoin can recover by reclaiming levels above $118,000–$120,000, which may lead to a retest of resistance at $124,000–$127,000.
Key Takeaways
- Immediate Support: $111,877 is crucial for Bitcoin’s price stability.
- Downside Risks: A failure to hold this level could lead to significant declines.
- Potential Recovery: A rebound above $120,000 could restore bullish sentiment.
Conclusion
In summary, Bitcoin’s current price action highlights critical support and resistance levels. Traders should closely monitor the $111,877 mark, as failure to hold could lead to further declines. Conversely, a recovery above $120,000 may signal a bullish reversal, making it essential to stay informed about market dynamics.
Bitcoin slips below wedge support near $115K, with analysts eyeing $112K–$100K as key levels while $127K is upside invalidation.
-
Bitcoin trades at $115,454 after breaking wedge support, with $111,877 identified as immediate support on the daily chart.
-
Analysts warn of downside toward $100K if $111,877 fails, with extended targets between $95,000 and $92,000.
-
Recovery above $118K–$120K could lift Bitcoin back toward $124K–$127K, with breakout potential toward $135K.
Bitcoin is having renewed technical pressure as analysts highlight a rising wedge pattern on the daily chart. The cryptocurrency has climbed from early-year levels near $73,000 to highs of $127,000.
However, the recent rejection near the upper wedge boundary around $127,000–$128,000 has shifted attention toward the formation’s narrowing structure. A rising wedge typically forms when prices move within converging upward-sloping lines, with momentum weakening as the pattern matures. This setup often precedes corrective phases, raising concern among traders monitoring Bitcoin’s current path.
Rising Wedge Pressures Daily Price Action
The structure shows Bitcoin making consistent higher highs and higher lows while confined between the wedge’s support and resistance. Price action now sits near $115,454, after slipping below the ascending support.
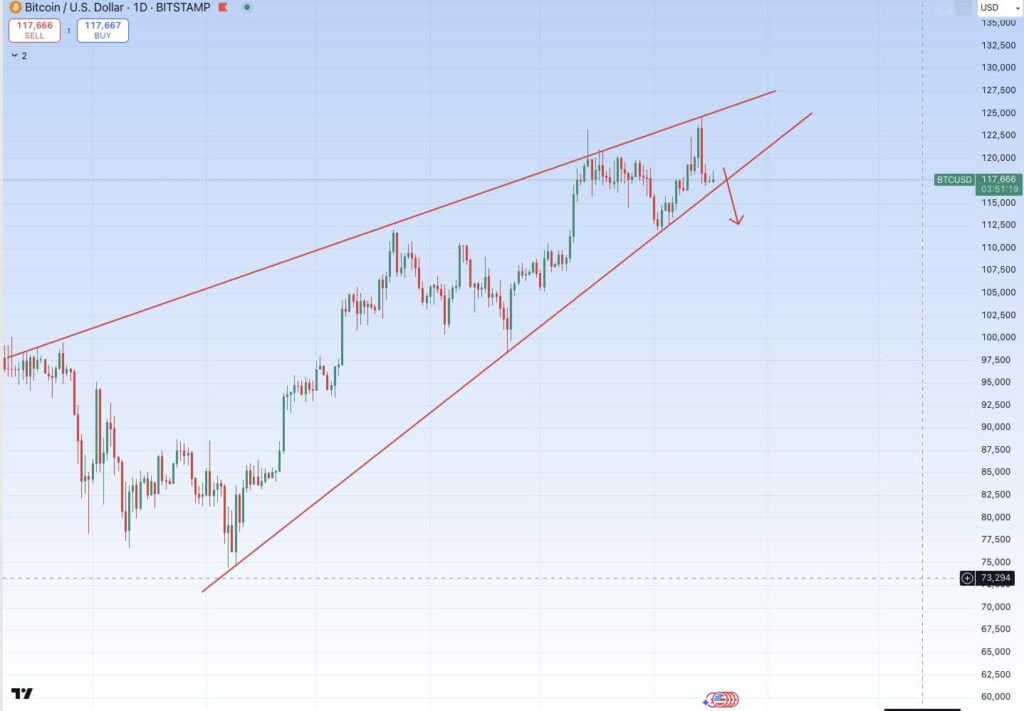 BTC/USD 1-day price chart, Source: CryptoBoss on X
According to Captain Faibik, this breakdown on the daily timeframe chart marks a key shift from bullish momentum to potential correction. The immediate support highlighted sits near $111,877, while further demand could appear in the $105,000–$108,000 region.
Key Downside Levels Come Into Focus
Analysts emphasize that a failure to hold $111,877 could open the way toward deeper retracement zones. Targets include the psychological $100,000 level, with extended weakness pointing toward $95,000–$92,000.
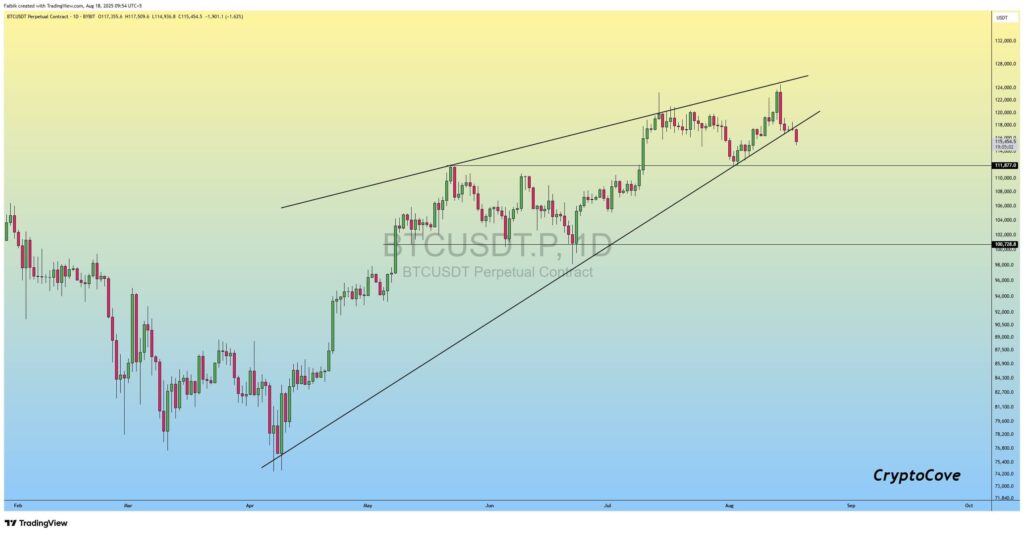 BTC/USDT Perpetual Contract 1-day price chart, Source: Captain Faibik on X
Earlier consolidation around these zones makes them significant pivot areas if selling accelerates. The wider base of the wedge sits near $73,294, representing the long-term support zone from which Bitcoin’s rally originated. These levels now serve as reference points for traders tracking the downside potential.
Upside Scenarios Still Remain Valid
Despite the bearish structure, recovery above key levels could restore confidence. Analysts note that if Bitcoin reclaims $118,000–$120,000, it may retest resistance at $124,000–$127,000.
A clear breakout above $127,000 would invalidate the wedge and extend targets toward $130,000–$135,000. However, with price consolidating near the lower wedge boundary, momentum leans weaker in the short term. Traders continue to weigh both outcomes closely, as Bitcoin’s next decisive move could determine the extent of correction or recovery.