Solana breakout momentum is driven by concentrated liquidity clusters and high‑leverage short liquidations that forced short covers, lifting SOL price from ~$220 support toward $245 resistance; heatmap data and rising 24h volume point to a possible break above $245 if sellers fail to defend that supply wall.
-
SOL price rebounded from $220 support due to short liquidations.
-
Resistance cluster at $235–$245 is the key supply zone to watch.
-
24h volume near $7B and liquidity heatmap show fresh orders above current price, signaling breakout potential.
Solana breakout: SOL price jumps from $220 support as short liquidations push volume higher — watch $245 resistance for a confirmed breakout. Read analysis.
What is driving the Solana breakout?
Solana breakout is driven primarily by liquidations of high‑leverage short positions and shifts in limit order liquidity, which forced covering that pushed the SOL price up from ~$220 support into the $230 area. Heatmap clusters reveal sellers concentrated at $235–$245, creating the next critical test.
How are liquidity heatmaps signaling the move?
Heatmap order‑book charts show dense liquidity pockets near $220 (support) and $235–$240 (resistance). When many limit orders were removed, price moved through a low‑liquidity gap toward $230. New orders appearing above current levels indicate sellers preparing to defend higher prices.
Why did short liquidations boost SOL price?
Short liquidations forced automated buy orders to close leveraged bets, creating sudden buying pressure. As shorts covered, trading volume spiked—classic liquidity hunting behavior—allowing SOL price to clear intraday resistance zones and test the $245 supply wall.
Liquidity Heatmap Reveals Critical Price Zones
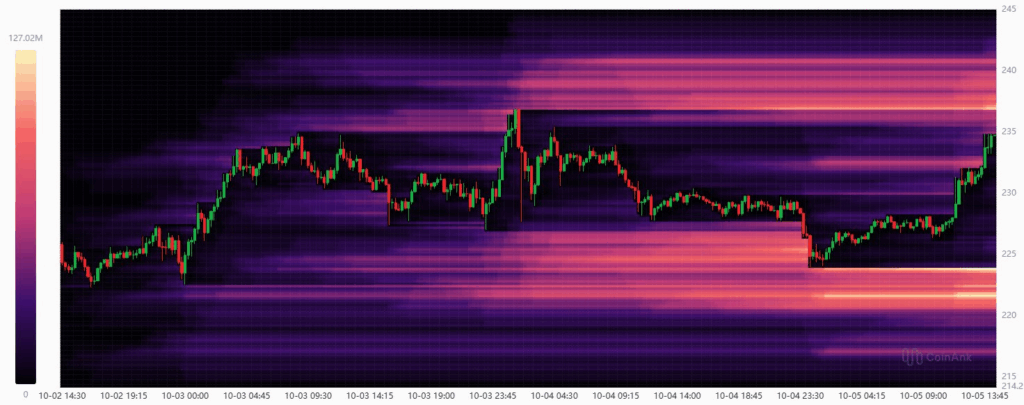
A recent heatmap order book chart combined with candlestick data gives a clear picture of Solana’s market dynamics from October 2 to 5. Price hovered between roughly $215 and $245 during this period.
 Source: CW Via X
Notably, strong liquidity clusters emerged near $220, creating a solid support zone that prevented further declines. Conversely, the $235–$240 area displays thick bands of sell orders, indicating significant resistance.
After dipping close to $223, SOL rebounded sharply through a low‑liquidity gap, breaking past the $230 mark. This move suggests many limit orders were withdrawn, allowing momentum to accelerate upward, while the heatmap shows new liquidity added above current levels.
Short Liquidations Fuel Upward Momentum
The recent surge coincides with a rise in liquidations of high‑leverage short positions, which amplified buying pressure. As shorts covered, exchanges recorded elevated buy volume, helping SOL push toward the $245 supply wall.
Market data at press time: SOL trading around $230.56, +2% intraday and ~15% over 7 days. Reported 24h trading volume near $7 billion, indicating strong participation in the move.
What levels should traders watch next?
Key levels: support near $220 and immediate resistance at $235–$240; the decisive supply wall sits at $245. A clear close above $245 on strong volume would signal an extended Solana breakout opportunity. Failure to clear $245 could prompt a pullback toward $220 or lower.
How to interpret order‑book signals for trading SOL
- Identify dense liquidity clusters (support/resistance) on the heatmap.
- Watch for sudden withdrawals of limit orders—these create low‑liquidity gaps for price to move through.
- Monitor liquidation events and 24h volume spikes as confirmation of momentum.
| Support | $220 | Strong buy clusters; first pullback target |
| Immediate Resistance | $235–$240 | Dense sell orders; short‑term choke point |
| Supply Wall | $245 | Key breakout confirmation level |
| 24h Volume | ~$7B | Elevated liquidity supporting move |
Frequently Asked Questions
Is this Solana breakout sustainable?
The breakout is sustainable only if SOL clears and holds above $245 on increased volume; otherwise, sellers clustered in that supply zone could push price back toward $220 support.
How do liquidations affect SOL price?
Liquidations force position closures that create rapid buy pressure when shorts are squeezed, often producing sharp, short‑term price moves and changes in liquidity distribution.
Where can I find the heatmap used in the analysis?
The heatmap referenced was a market order‑book visualization shared publicly (Source: CW Via X) and used here for interpretation; no external links are provided in this report.
Key Takeaways
- Short liquidations boosted momentum: Forced short covers drove buying into $230 area.
- Critical levels matter: $220 support and $245 supply wall will dictate next directional bias.
- Watch volume and heatmap clusters: Confirmation requires a close above $245 on elevated volume.
Conclusion
This analysis finds that the current Solana breakout is the product of short liquidations and shifting limit order liquidity, with SOL price testing a decisive $245 supply wall. Traders should monitor heatmap clusters, liquidation flows, and 24h volume for confirmation before assuming sustained upside. COINOTAG will continue tracking developments and updating this analysis.