Bitcoin is retesting the crucial $112,500 support level in a bullish pattern, with traders closely monitoring resistance near $115,600 and liquidity zones to anticipate the next major price move.
-
Bitcoin holds $112.5K as key support after breakout, signaling a potential rally continuation.
-
Volatility increases with resistance at $115.6K challenging upward momentum.
-
Market watchers note possible price targets: a bounce to $132.5K or a dip toward $106K depending on market reaction.
Bitcoin retests $112.5K support amid rising volatility and key resistance near $115.6K. Stay informed on market momentum and liquidity zones for your next move.
What Are the Key Levels Influencing Bitcoin’s Current Price Action?
Bitcoin’s price is currently testing critical support at $112,500 after a recent breakout, while facing resistance near $115,675. This range is pivotal, as the $112.5K level acts as a “reload zone” for buyers, and $115.6K serves as a strong overhead barrier. The CME Futures chart highlights this resistance, where Bitcoin failed to hold above $115K, creating significant selling pressure.
How Does the Bullish Retest Pattern Signal Future Price Movements?
The retest of $112,500 follows a classic bullish breakout pattern characterized by multiple higher lows and a decisive break above horizontal resistance. According to market analyst Merlijn The Trader, this pattern indicates strength rather than weakness, urging traders to avoid panic selling. This zone is viewed as a strategic entry point for institutional buyers preparing for the next upward leg.

Bitcoin’s recent pullback to $113,599.8, down 1.87%, tests the strength of the breakout support. This movement reflects a healthy consolidation phase rather than a reversal, reinforcing the bullish outlook.
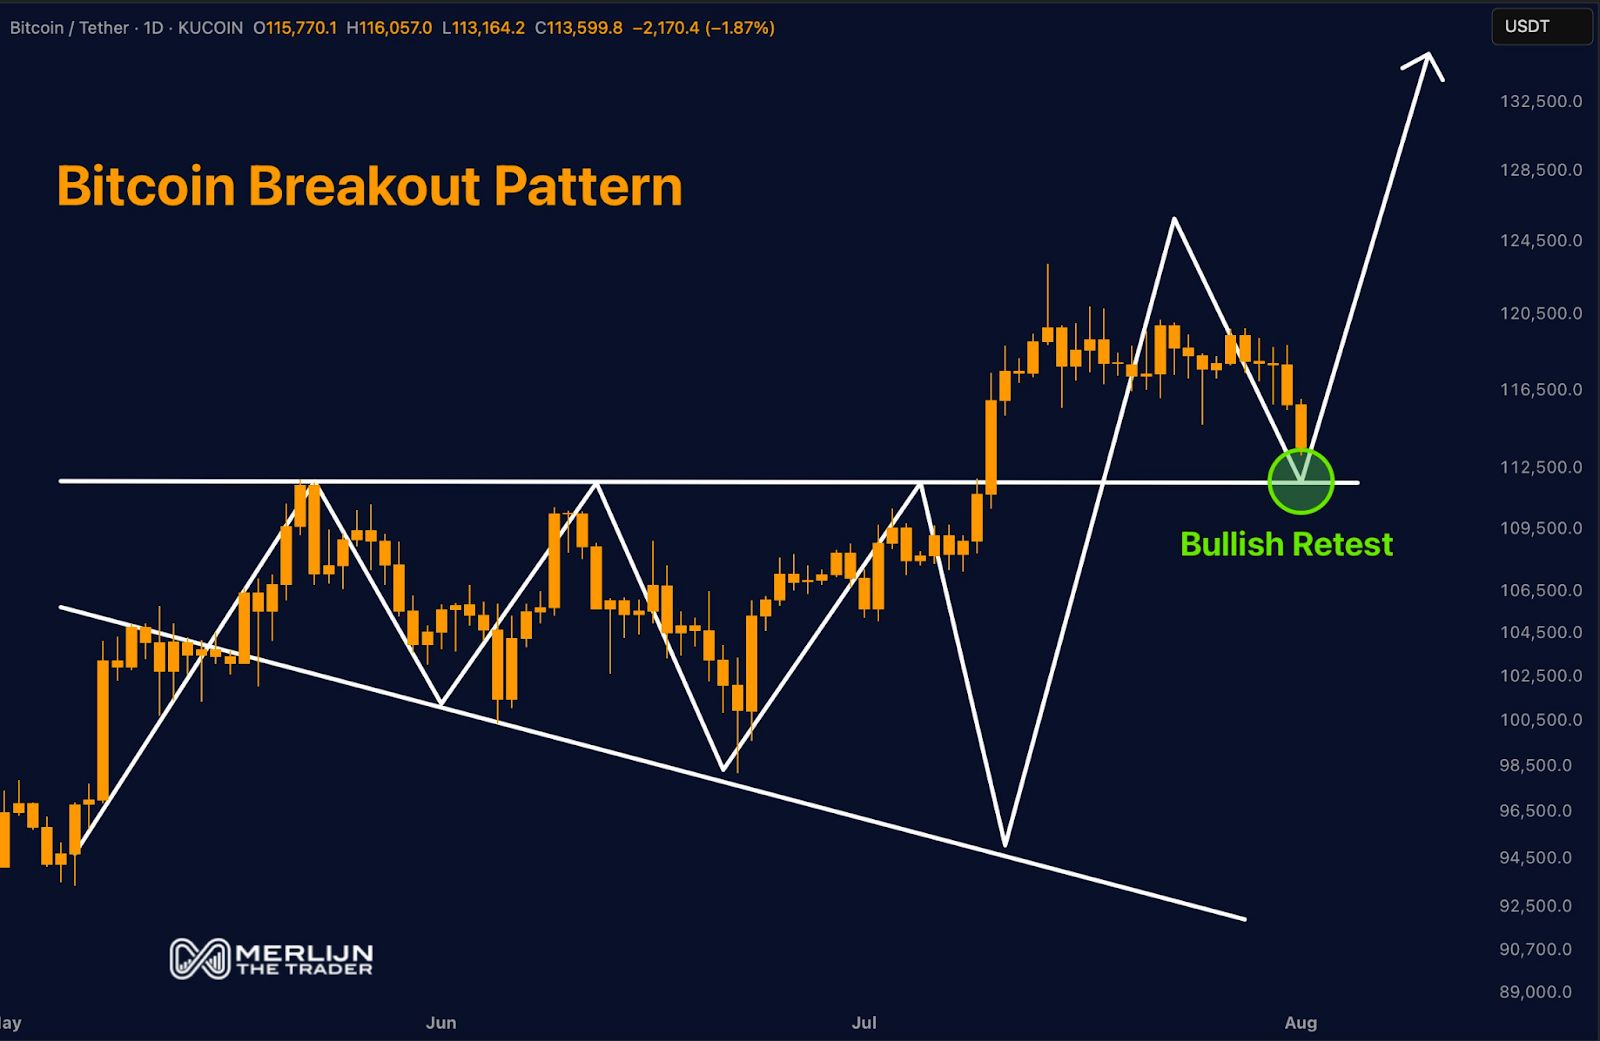
Source: Merlijn The Trader
What Does Volatility and Resistance Tell Us About Bitcoin’s Next Move?
Bitcoin’s price action shows increased volatility as it struggles to surpass the $115,675 resistance level. The CME Futures chart reveals that after filling a gap, Bitcoin failed to maintain gains above $115K, turning this level into a strong resistance zone. This has led to a series of lower highs, signaling cautious sentiment among traders.
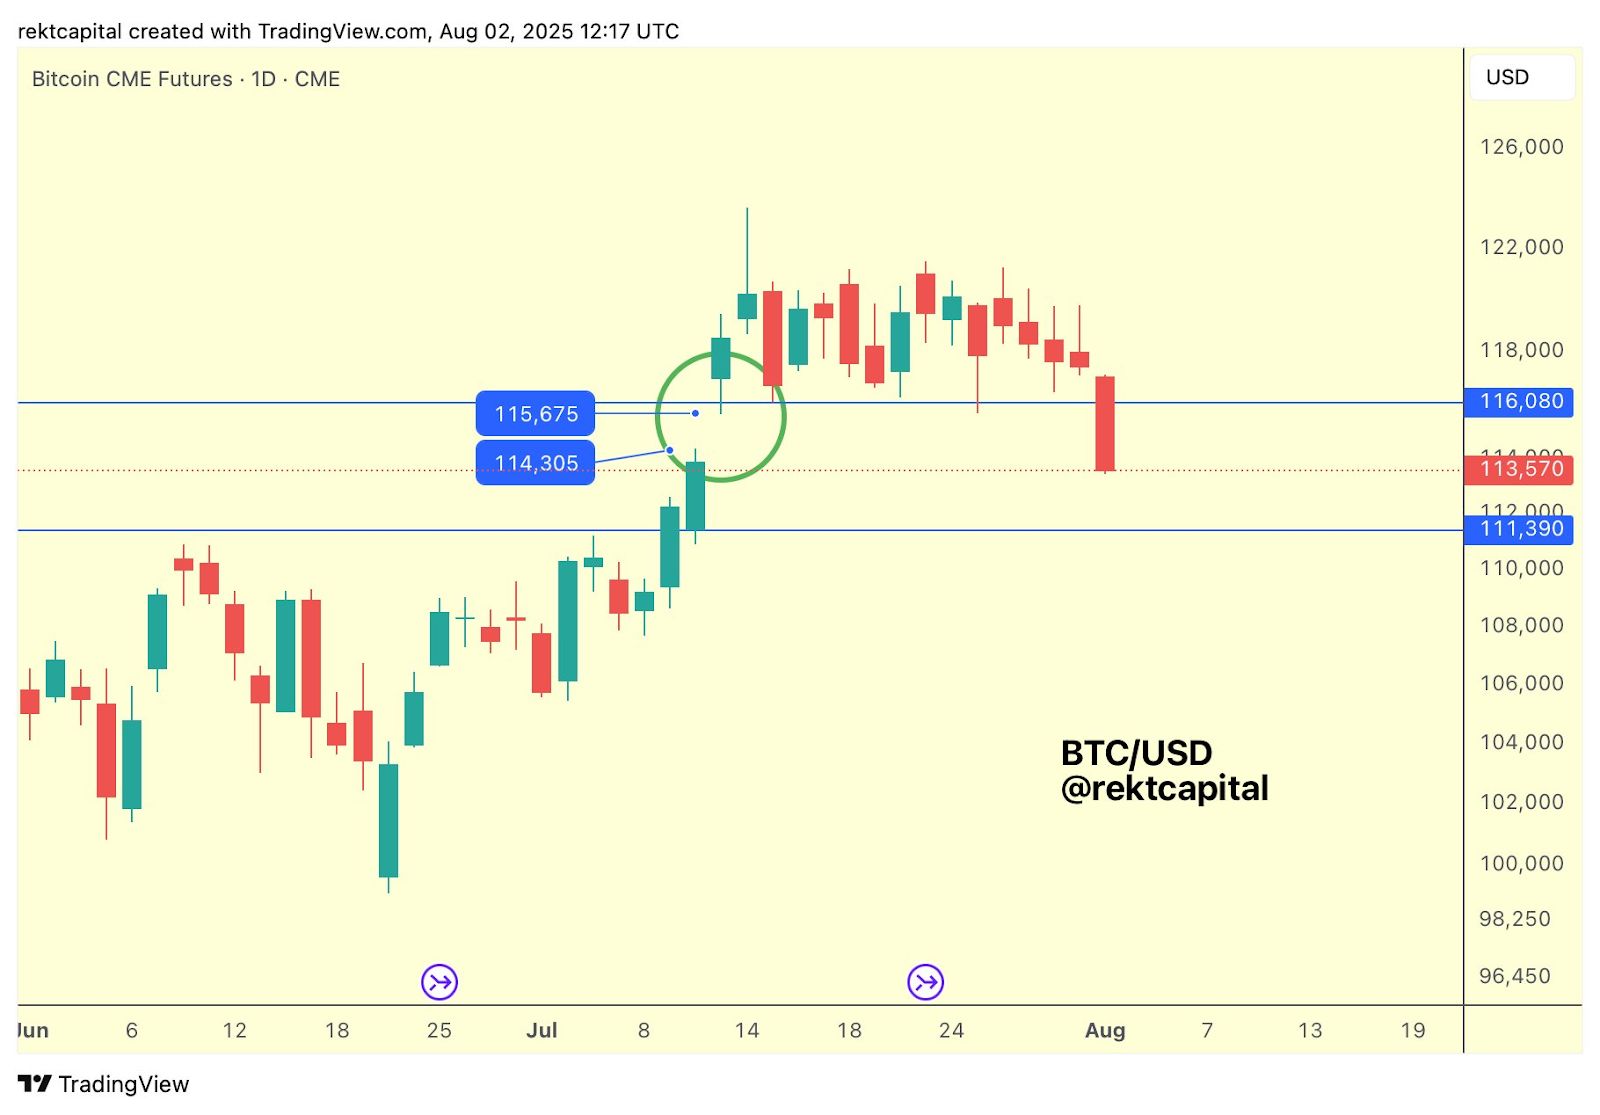
Source: Rekt Capital
How Do Oversold Conditions and Liquidity Zones Affect Bitcoin’s Price Outlook?
Analyst Cryptoinsightuk notes Bitcoin is currently in oversold territory on the 4-hour chart, a condition historically associated with local price bottoms. Additionally, significant liquidity clusters exist above $125,000, while downside liquidity near $106,000 remains a potential target. These zones create a price corridor where Bitcoin may either rebound toward $132,500 or decline to $106,000 depending on market momentum and structure.
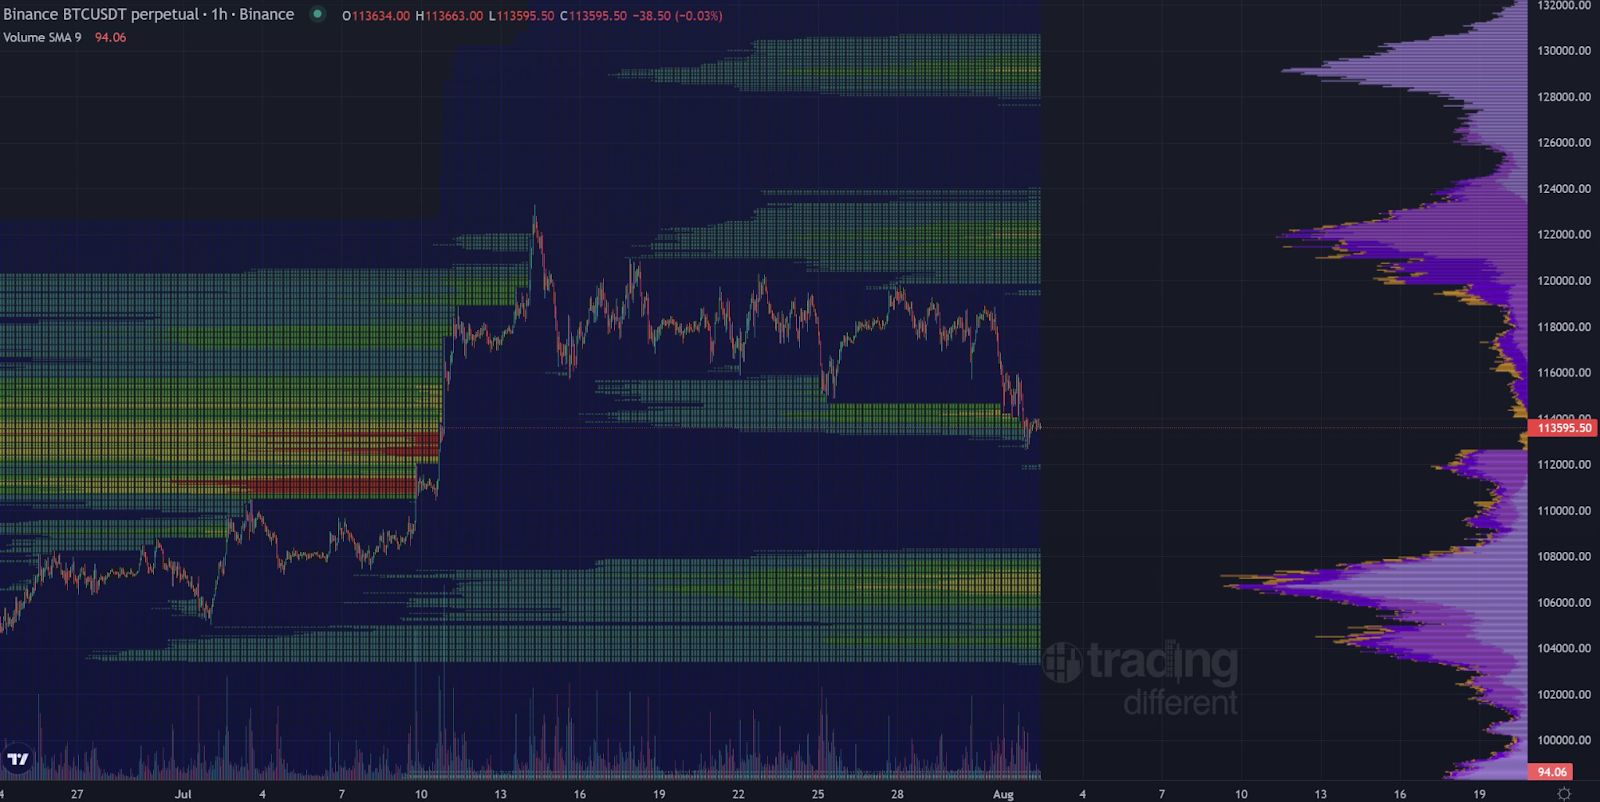
Source: Cryptoinsightuk
| $112,500 | Key Support | Potential bounce zone for buyers |
| $115,675 | Strong Resistance | Overhead pressure limiting gains |
| $132,500 | Upside Target | Possible rally if momentum sustains |
| $106,000 | Downside Liquidity | Potential dip if support fails |
Frequently Asked Questions
Why is the $112,500 level critical for Bitcoin traders?
The $112,500 level acts as a key support zone after a breakout, serving as a potential “reload area” where buyers accumulate before the next upward move. Holding this level is crucial to maintain bullish momentum.
What does Bitcoin’s oversold condition indicate?
Bitcoin’s oversold status on shorter timeframes often signals a local bottom, suggesting that a price rebound may be imminent as traders seek to capitalize on undervalued levels.
Key Takeaways
- Bitcoin retesting $112,500 support: Confirms a bullish pattern and potential entry point for buyers.
- Resistance near $115,675: Acts as a significant barrier that must be overcome for further gains.
- Price targets of $132,500 or $106,000: Dependent on market momentum, liquidity zones, and trader sentiment.
Conclusion
Bitcoin’s current retest of the $112,500 support level within a bullish structure highlights a critical decision point for traders. With resistance near $115,675 and oversold signals in play, the market is poised for a significant move either upward toward $132,500 or downward to $106,000. Monitoring liquidity zones and momentum will be essential for anticipating Bitcoin’s next major price action.