Bitget App
Trade smarter
Open
HomepageSign up
Bitget>
News>
Celestia (TIA) Price Analysis: Will TIA Break Out or Break Down?

Celestia (TIA) Price Analysis: Will TIA Break Out or Break Down?

CoinEdition2024/10/31 16:00
By: Coin Edition
TIA-4.18%
TIA holds $4.68 support, eyes $4.80 as traders weigh bullish rebound potential Market pauses on TIA as declining volume signals caution in volatile session Longs face $3M in liquidations as TIA’s range struggles test trader sentiment
  • TIA holds $4.68 support, eyes $4.80 as traders weigh bullish rebound potential
  • Market pauses on TIA as declining volume signals caution in volatile session
  • Longs face $3M in liquidations as TIA’s range struggles test trader sentiment

Celestia’s native token, TIA, is attracting attention as traders assess its recent price action. Priced at $4.69 at press time, TIA has fallen 0.27% in the past day, suggesting a volatile environment. This decline reflects a general intraday price pattern where TIA peaks before falling back to its current level.

TIA’s immediate support level is $4.68. This zone has historically helped stabilize the price. If TIA drops below this mark, it could fall further to around $4.50, a critical level that may prevent further declines.

Read also: Celestia Raises $100M, TIA Token Jumps 17% Overnight

Celestia (TIA) Price Analysis: Will TIA Break Out or Break Down? image 0 Celestia (TIA) Price Analysis: Will TIA Break Out or Break Down? image 1 
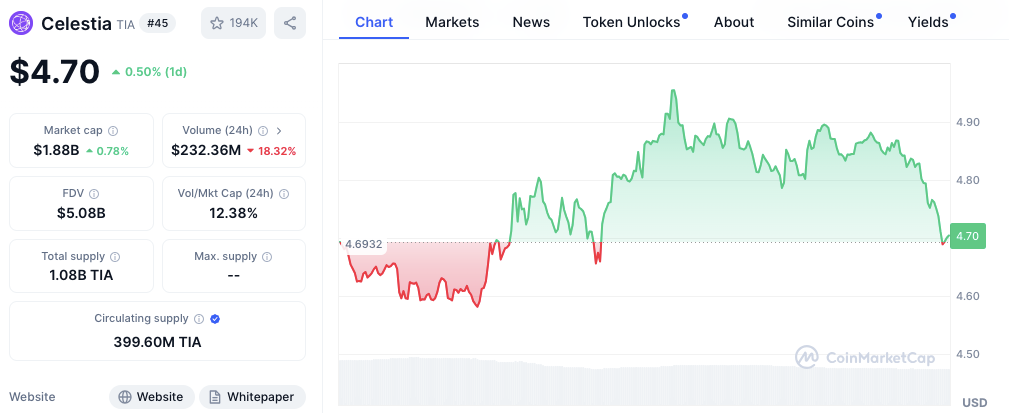
Source: Coinmarketcap

On the upside, TIA faces resistance near $4.93, which has limited recent upward momentum. Additionally, $4.80 represents another hurdle, as the price repeatedly tests and retreats from this level during intraday trading. These resistance points will likely determine the upper bounds of TIA’s price action if buyers gain momentum.

Potential Price Scenarios

TIA’s price path depends on its ability to stay above $4.68. If it does, a rally to retest $4.80 is possible, with a subsequent push toward $4.93. A breakout beyond this mark could lead to further gains. However, a drop below $4.68 could trigger a downtrend, targeting the $4.50 support level.

Derivatives Data and Market Sentiment

As per Coinglass data , TIA’s derivatives data reveals a cautious trader sentiment, indicated by declining trading volume and open interest. The 24-hour trading volume fell by 12.46% to $987.69 million, while open interest decreased by 3.71% to $284.20 million. These reductions highlight a market pullback, with traders potentially reacting to recent price volatility.

Moreover, while the long/short ratios on OKX and Binance show a tendency toward long positions OKX at 3.04 and Binance at 2.81 the overall market exhibits a near-parity long/short ratio of 0.9421. This balanced ratio indicates relatively equal interest in both long and short positions. 

Notably, long traders faced significant losses, with liquidations totaling $1.03 million and $2.03 million over the past 12 and 24 hours, respectively. Short liquidations were comparatively lower, at $178.69K and $536.52K, suggesting recent price fluctuations may have affected over-leveraged long positions.

Disclaimer: The information presented in this article is for informational and educational purposes only. The article does not constitute financial advice or advice of any kind. Coin Edition is not responsible for any losses incurred as a result of the utilization of content, products, or services mentioned. Readers are advised to exercise caution before taking any action related to the company.

Disclaimer: The content of this article solely reflects the author's opinion and does not represent the platform in any capacity. This article is not intended to serve as a reference for making investment decisions.
PoolX: Earn new token airdrops
Lock your assets and earn 10%+ APR
Lock now!

You may also like

New spot margin trading pair — HOLO/USDT!
Bitget Announcement2025/09/12 07:46
FUN drops by 32.34% within 24 hours as it faces a steep short-term downturn

- FUN plunged 32.34% in 24 hours to $0.008938, marking a 541.8% monthly loss amid prolonged bearish trends. - Technical breakdowns, elevated selling pressure, and forced liquidations highlight deteriorating market sentiment and risk-off behavior. - Analysts identify key support below $0.0080 as critical, with bearish momentum confirmed by RSI (<30) and MACD indicators. - A trend-following backtest strategy proposes short positions based on technical signals to capitalize on extended downward trajectories.

Bitget-RWA2025/09/12 06:14
OPEN has dropped by 189.51% within 24 hours during a significant market pullback

- OPEN's price plummeted 189.51% in 24 hours to $0.8907, marking its largest intraday decline in history. - The token fell 3793.63% over 7 days, matching identical monthly and yearly declines, signaling severe bearish momentum. - Technical analysts cite broken support levels and lack of bullish catalysts as key drivers of the sustained sell-off. - Absence of stabilizing volume or reversal patterns leaves the market vulnerable to further downward pressure.

Bitget-RWA2025/09/12 06:14
New spot margin trading pair — LINEA/USDT!
Bitget Announcement2025/09/11 10:04

Trending news

More
1
New spot margin trading pair — HOLO/USDT!
2
FUN drops by 32.34% within 24 hours as it faces a steep short-term downturn

Crypto prices

More
Bitcoin
Bitcoin
BTC
$115,930.08
+0.03%
Ethereum
Ethereum
ETH
$4,622.47
-0.79%
XRP
XRP
XRP
$3.05
-2.39%
Tether USDt
Tether USDt
USDT
$1
+0.00%
Solana
Solana
SOL
$241.67
+0.16%
BNB
BNB
BNB
$933.63
+0.20%
USDC
USDC
USDC
$1
+0.03%
Dogecoin
Dogecoin
DOGE
$0.2799
-2.88%
TRON
TRON
TRX
$0.3490
-0.25%
Cardano
Cardano
ADA
$0.8911
-4.13%
How to sell PI
Bitget lists PI – Buy or sell PI quickly on Bitget!
Trade now
Become a trader now?A welcome pack worth 6200 USDT for new users!
Sign up now
Trade smarter