Bitget App
Trade smarter
Open
HomepageSign up
Bitget>
News>
FET Shows Signs of Bullish Momentum Amid Liquidation Risks and Rising Active Addresses

FET Shows Signs of Bullish Momentum Amid Liquidation Risks and Rising Active Addresses

Coinotag2024/12/09 16:00
By: Crypto Vira
BTC-0.24%FET+0.33%
  • FET’s recent price action suggests bullish momentum, with a potential target looming amid significant liquidity risks and rising market interest.

  • Despite a substantial 11% drawdown this week, FET remains fundamentally bullish, bolstered by technical patterns and increased trading volumes.

  • According to COINOTAG, “The recent bullish wick under this week’s candle points to upcoming upward trends, suggesting market resilience.”

This article discusses FET’s bullish outlook amid trading volatility and potential liquidation risks, focusing on key price levels and market trends.

Market Resilience: FET’s Recent Trading Patterns

FET’s market performance has been characterized by significant volatility this week, with a notable drawdown of over 11%. However, the overall outlook remains strong as FET’s price has not dipped below the crucial $1.74 threshold. This price point is pivotal, as it marks a transition between bearish and bullish market conditions, serving as a potential support area that could dictate future price movements.

Understanding the Price Dynamics and Liquidation Risks

Recent trading data reveals that if FET’s price approaches the $2.00 mark, more than $1.2 billion in leveraged positions may face liquidation. The $1.8 level is identified as key support, while the resistance sits near $2.1. These dynamics could induce significant market activity, suggesting that traders should be vigilant about these critical thresholds. Market sentiment can shift rapidly, indicating a need for astute monitoring of price behavior within these ranges.

FET Shows Signs of Bullish Momentum Amid Liquidation Risks and Rising Active Addresses image 0

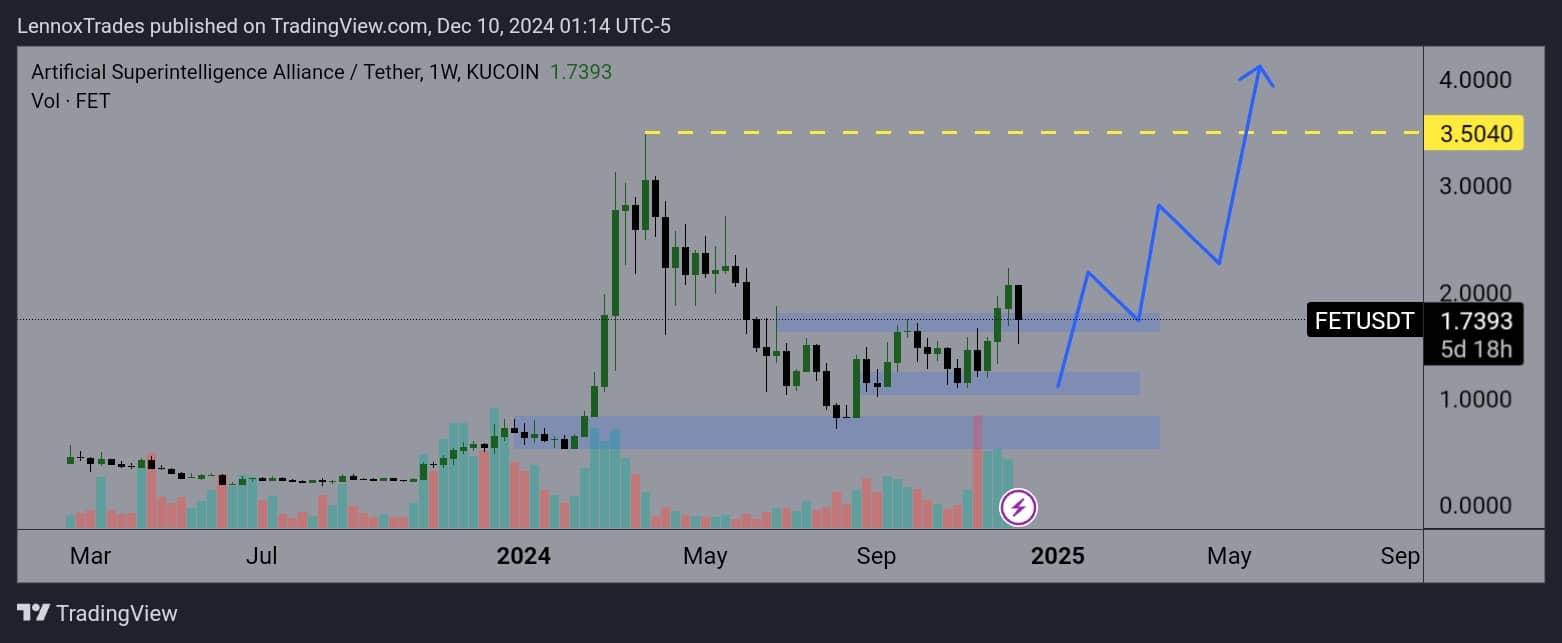
Source: Trading View

Key Liquidation Zones for Strategic Trading

The liquidity heatmap for FET/USDT reveals significant liquidation zones that traders should note. With the price near $2.00, the potential risk of liquidation can lead to sharp price corrections, especially if FET is unable to maintain support at $1.8. Such liquidations could create a domino effect in the market, further exacerbating price volatility.
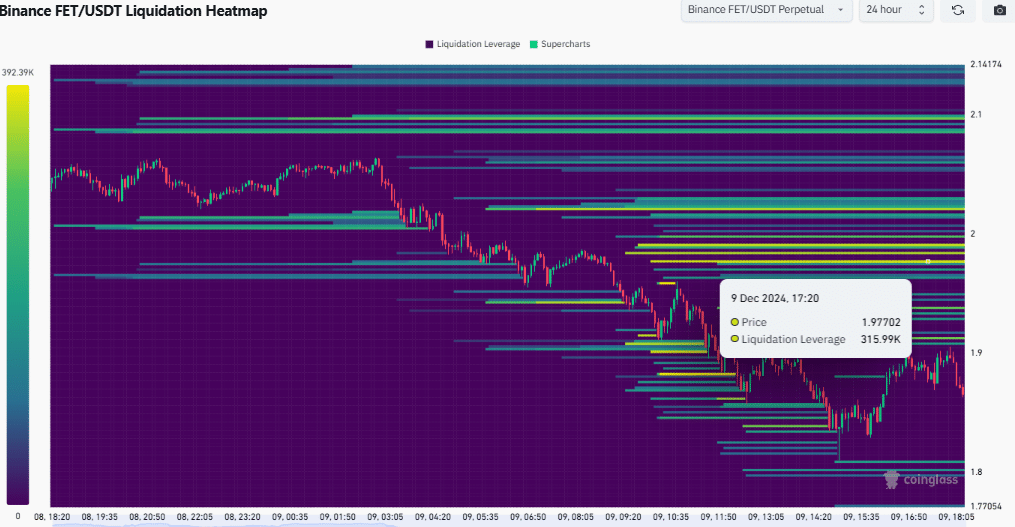
FET Shows Signs of Bullish Momentum Amid Liquidation Risks and Rising Active Addresses image 1

Source: Coinglass

Trends in Daily Active Addresses

Examining on-chain data reveals a notable increase in FET’s daily active addresses, indicating a growing interest in the cryptocurrency. The correlation between peaks in active addresses and price rises supports the notion that trading activity is fostering upward momentum in FET’s value.

FET Shows Signs of Bullish Momentum Amid Liquidation Risks and Rising Active Addresses image 2

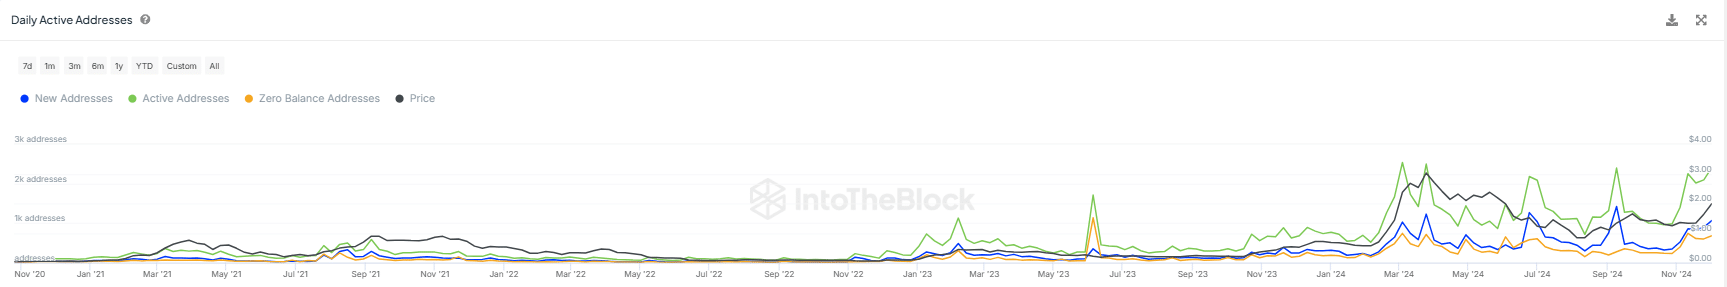
Source: IntoTheBlock

Conclusion

In conclusion, FET currently exhibits strong bullish signals despite recent volatility. The resistance levels at $2.1 and liquidation risks around $2 highlight the need for strategic trading approaches. Monitoring network activity and price movements around these pivotal zones is essential for navigating potential market shifts effectively. Traders should remain vigilant and prepared for any sudden changes in market sentiment, enhancing their ability to capitalize on FET’s outlined bullish potential.

In Case You Missed It: Bitcoin Approaches $100,000: Exploring Its Symbolic Significance and Future Prospects in the Evolving Crypto Landscape
Disclaimer: The content of this article solely reflects the author's opinion and does not represent the platform in any capacity. This article is not intended to serve as a reference for making investment decisions.
PoolX: Earn new token airdrops
Lock your assets and earn 10%+ APR
Lock now!

You may also like

New spot margin trading pair — HOLO/USDT!
Bitget Announcement2025/09/12 07:46
FUN drops by 32.34% within 24 hours as it faces a steep short-term downturn

- FUN plunged 32.34% in 24 hours to $0.008938, marking a 541.8% monthly loss amid prolonged bearish trends. - Technical breakdowns, elevated selling pressure, and forced liquidations highlight deteriorating market sentiment and risk-off behavior. - Analysts identify key support below $0.0080 as critical, with bearish momentum confirmed by RSI (<30) and MACD indicators. - A trend-following backtest strategy proposes short positions based on technical signals to capitalize on extended downward trajectories.

Bitget-RWA2025/09/12 06:14
OPEN has dropped by 189.51% within 24 hours during a significant market pullback

- OPEN's price plummeted 189.51% in 24 hours to $0.8907, marking its largest intraday decline in history. - The token fell 3793.63% over 7 days, matching identical monthly and yearly declines, signaling severe bearish momentum. - Technical analysts cite broken support levels and lack of bullish catalysts as key drivers of the sustained sell-off. - Absence of stabilizing volume or reversal patterns leaves the market vulnerable to further downward pressure.

Bitget-RWA2025/09/12 06:14
New spot margin trading pair — LINEA/USDT!
Bitget Announcement2025/09/11 10:04

Trending news

More
1
New spot margin trading pair — HOLO/USDT!
2
FUN drops by 32.34% within 24 hours as it faces a steep short-term downturn

Crypto prices

More
Bitcoin
Bitcoin
BTC
$115,079.59
-0.76%
Ethereum
Ethereum
ETH
$4,606.13
-1.32%
XRP
XRP
XRP
$3.04
-2.23%
Tether USDt
Tether USDt
USDT
$1
+0.00%
Solana
Solana
SOL
$240.99
-0.83%
BNB
BNB
BNB
$926.34
-0.71%
USDC
USDC
USDC
$0.9999
+0.02%
Dogecoin
Dogecoin
DOGE
$0.2785
-2.49%
TRON
TRON
TRX
$0.3491
-0.22%
Cardano
Cardano
ADA
$0.8888
-3.66%
How to sell PI
Bitget lists PI – Buy or sell PI quickly on Bitget!
Trade now
Become a trader now?A welcome pack worth 6200 USDT for new users!
Sign up now
Trade smarter