Bitget App
Trade smarter
Open
HomepageSign up
Bitget>
News>
EOS Surges Following Key MA Breakout – Can Toncoin (TON) Do the Same?

EOS Surges Following Key MA Breakout – Can Toncoin (TON) Do the Same?

CoinsProbe2025/04/02 15:06
By: Nilesh Hembade
TON+0.21%EOS0.00%

Date: Wed, April 02, 2025 | 05:20 AM GMT

The cryptocurrency market is showing mixed performance as today, U.S. President Donald Trump is expected to impose reciprocal tariffs on all countries.

Meanwhile, in the altcoin market, EOS (EOS) is gaining traction with impressive gains of over 17% in the last 24 hours and a solid 38% weekly rally, which comes after significant technical moves. On the other hand, Toncoin (TON) is trading in the red but hinting at a potential similar move to EOS.

EOS Surges Following Key MA Breakout – Can Toncoin (TON) Do the Same? image 0 
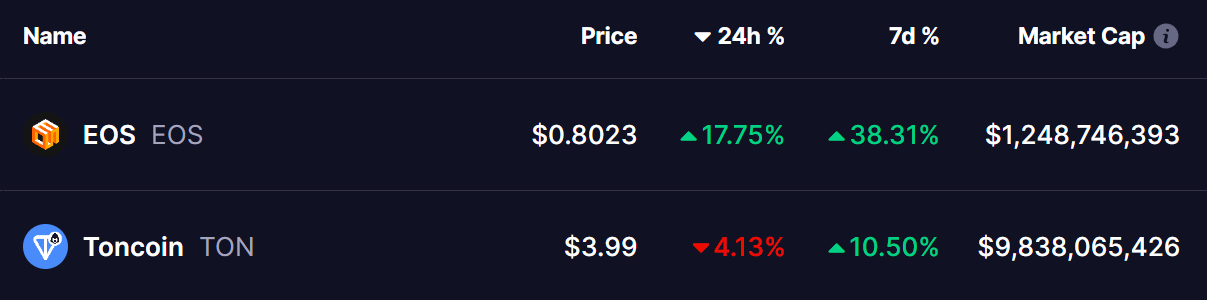
Source: Coinmarketcap

EOS (EOS)

EOS has gained bullish momentum after its falling wedge breakout , which occurred recently on March 18 when it surpassed its resistance trendline at $0.51.

EOS Surges Following Key MA Breakout – Can Toncoin (TON) Do the Same? image 1 
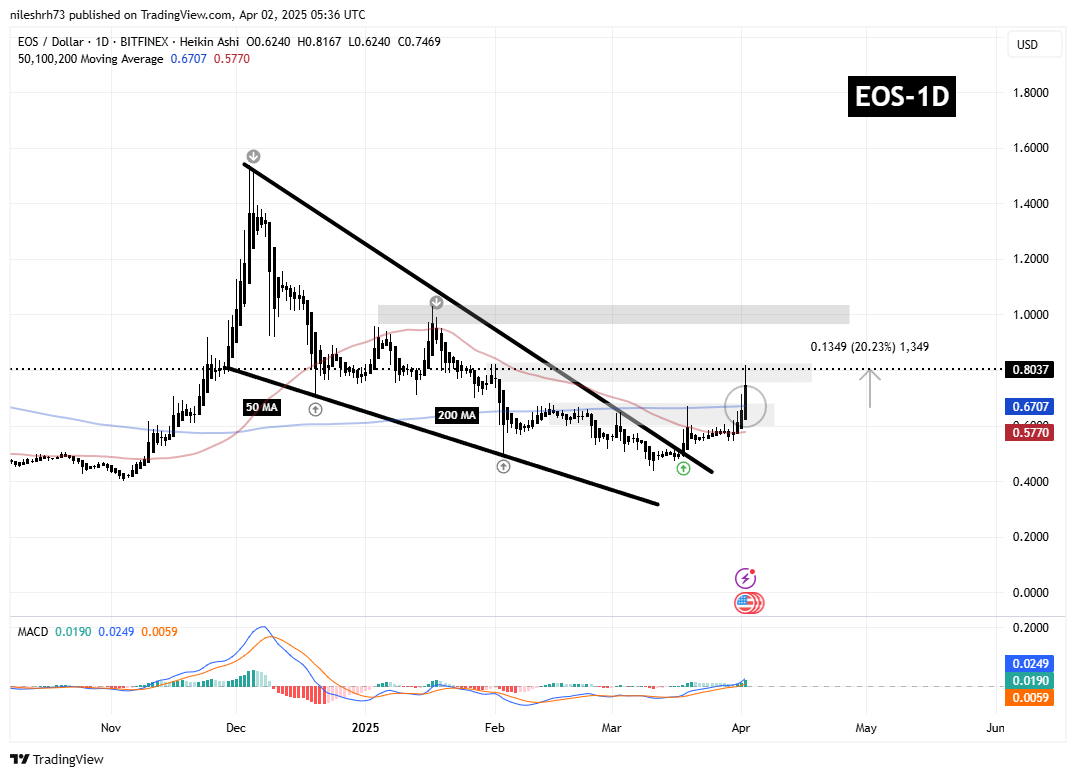
EOS (EOS) Daily Chart/Coinsprobe (Source: Tradingview)

Following some consolidation, EOS saw a jump above the resistance of the 50-day moving average (MA) and $0.68, which led to a solid move today above its key 200-day MA resistance. This breakout became the main catalyst behind today’s pump, sending its price higher by 20% to the resistance of $0.81. Currently, EOS is trading around $0.80.

From here, if EOS manages to move above this critical resistance zone of $0.81-$0.82, it could lead to an extended rally toward the next upside resistance zone of $1.03. This would represent a further 28% increase from its current price level.

Toncoin (TON)

TON appears to be following a similar path to EOS, as it also made a falling wedge breakout on March 19. This breakout saw TON move above its resistance trendline and the 50-day moving average (MA) at $3.55.

EOS Surges Following Key MA Breakout – Can Toncoin (TON) Do the Same? image 2 
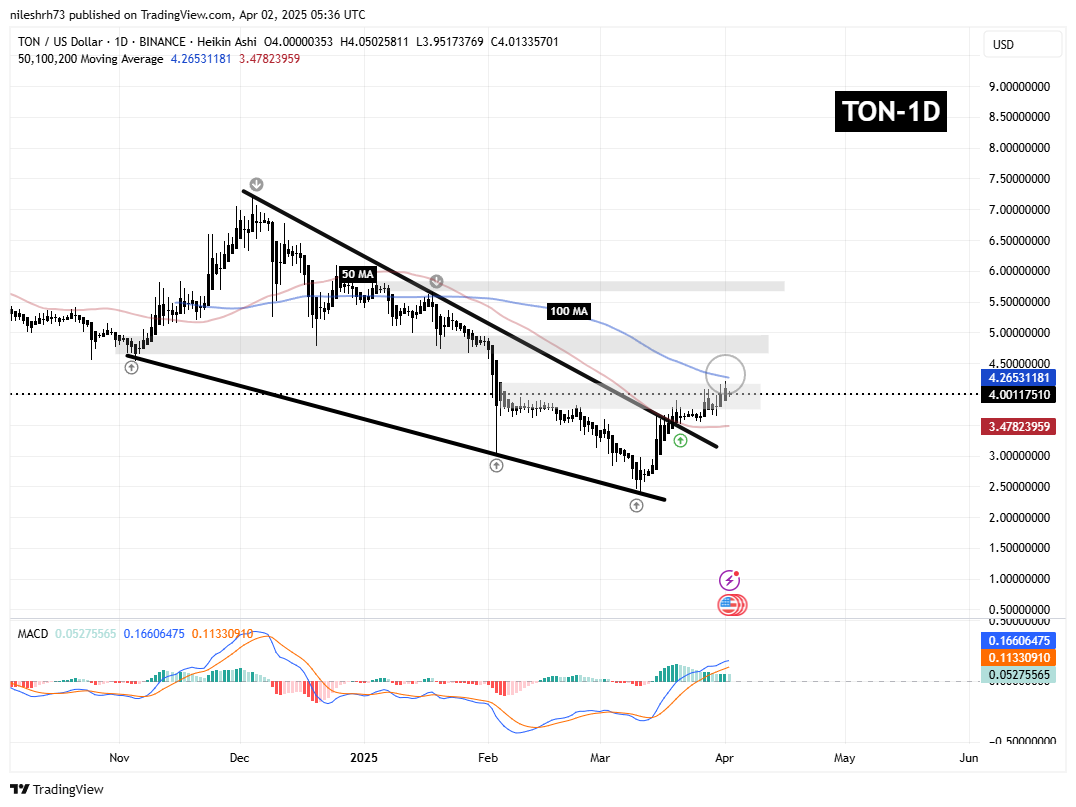
Toncoin (TON) Daily Chart/Coinsprobe (Source: Tradingview)

This move triggered an upside rally, pushing TON to $4.00, where the next crucial resistance stands at the 100-day MA, around $4.29—a level very similar to EOS’s breakout setup. A confirmed breakout above this level could solidify a recovery and uptrend, potentially propelling TON toward its next resistance zones at $4.91 and $5.84. This represents a potential 47% upside from current levels if bullish momentum sustains.

Final Thoughts

Both EOS and TON have shown signs of strength after breaking out of their falling wedge patterns. EOS has already confirmed its bullish momentum by breaking above the 200-day MA, while TON is still testing its 100-day MA resistance. If TON follows EOS’s path, it could be poised for a similar rally in the coming days.

Disclaimer: This article is for informational purposes only and not financial advice. Always conduct your own research before investing in cryptocurrencies.

Disclaimer: The content of this article solely reflects the author's opinion and does not represent the platform in any capacity. This article is not intended to serve as a reference for making investment decisions.
PoolX: Earn new token airdrops
Lock your assets and earn 10%+ APR
Lock now!

You may also like

New spot margin trading pair — HOLO/USDT!
Bitget Announcement2025/09/12 07:46
FUN drops by 32.34% within 24 hours as it faces a steep short-term downturn

- FUN plunged 32.34% in 24 hours to $0.008938, marking a 541.8% monthly loss amid prolonged bearish trends. - Technical breakdowns, elevated selling pressure, and forced liquidations highlight deteriorating market sentiment and risk-off behavior. - Analysts identify key support below $0.0080 as critical, with bearish momentum confirmed by RSI (<30) and MACD indicators. - A trend-following backtest strategy proposes short positions based on technical signals to capitalize on extended downward trajectories.

Bitget-RWA2025/09/12 06:14
OPEN has dropped by 189.51% within 24 hours during a significant market pullback

- OPEN's price plummeted 189.51% in 24 hours to $0.8907, marking its largest intraday decline in history. - The token fell 3793.63% over 7 days, matching identical monthly and yearly declines, signaling severe bearish momentum. - Technical analysts cite broken support levels and lack of bullish catalysts as key drivers of the sustained sell-off. - Absence of stabilizing volume or reversal patterns leaves the market vulnerable to further downward pressure.

Bitget-RWA2025/09/12 06:14
New spot margin trading pair — LINEA/USDT!
Bitget Announcement2025/09/11 10:04

Trending news

More
1
New spot margin trading pair — HOLO/USDT!
2
FUN drops by 32.34% within 24 hours as it faces a steep short-term downturn

Crypto prices

More
Bitcoin
Bitcoin
BTC
$115,903.67
-0.02%
Ethereum
Ethereum
ETH
$4,686
-0.35%
XRP
XRP
XRP
$3.12
+0.69%
Tether USDt
Tether USDt
USDT
$1
+0.00%
Solana
Solana
SOL
$248.78
+2.72%
BNB
BNB
BNB
$936.49
+0.97%
USDC
USDC
USDC
$0.9998
+0.01%
Dogecoin
Dogecoin
DOGE
$0.2922
+5.04%
TRON
TRON
TRX
$0.3510
-0.22%
Cardano
Cardano
ADA
$0.9271
+0.04%
How to sell PI
Bitget lists PI – Buy or sell PI quickly on Bitget!
Trade now
Become a trader now?A welcome pack worth 6200 USDT for new users!
Sign up now
Trade smarter