XRP News Today? What the Chart Is Secretly Signaling for April!
Ripple’s XRP has been moving with noticeable hesitation recently, struggling to reclaim its earlier bullish momentum. As of April 2, 2025, the daily chart reveals a tightly squeezed price zone just above a critical support layer, hinting at a potential explosion — either upward or downward. This analysis dives deep into XRP’s current structure using Heikin Ashi candles, multiple moving averages, and the Accumulation/Distribution Line (ADL) to predict what might come next for this major altcoin.
XRP News Today: Is XRP Gearing Up for a Major Reversal or Just Drifting Lower?
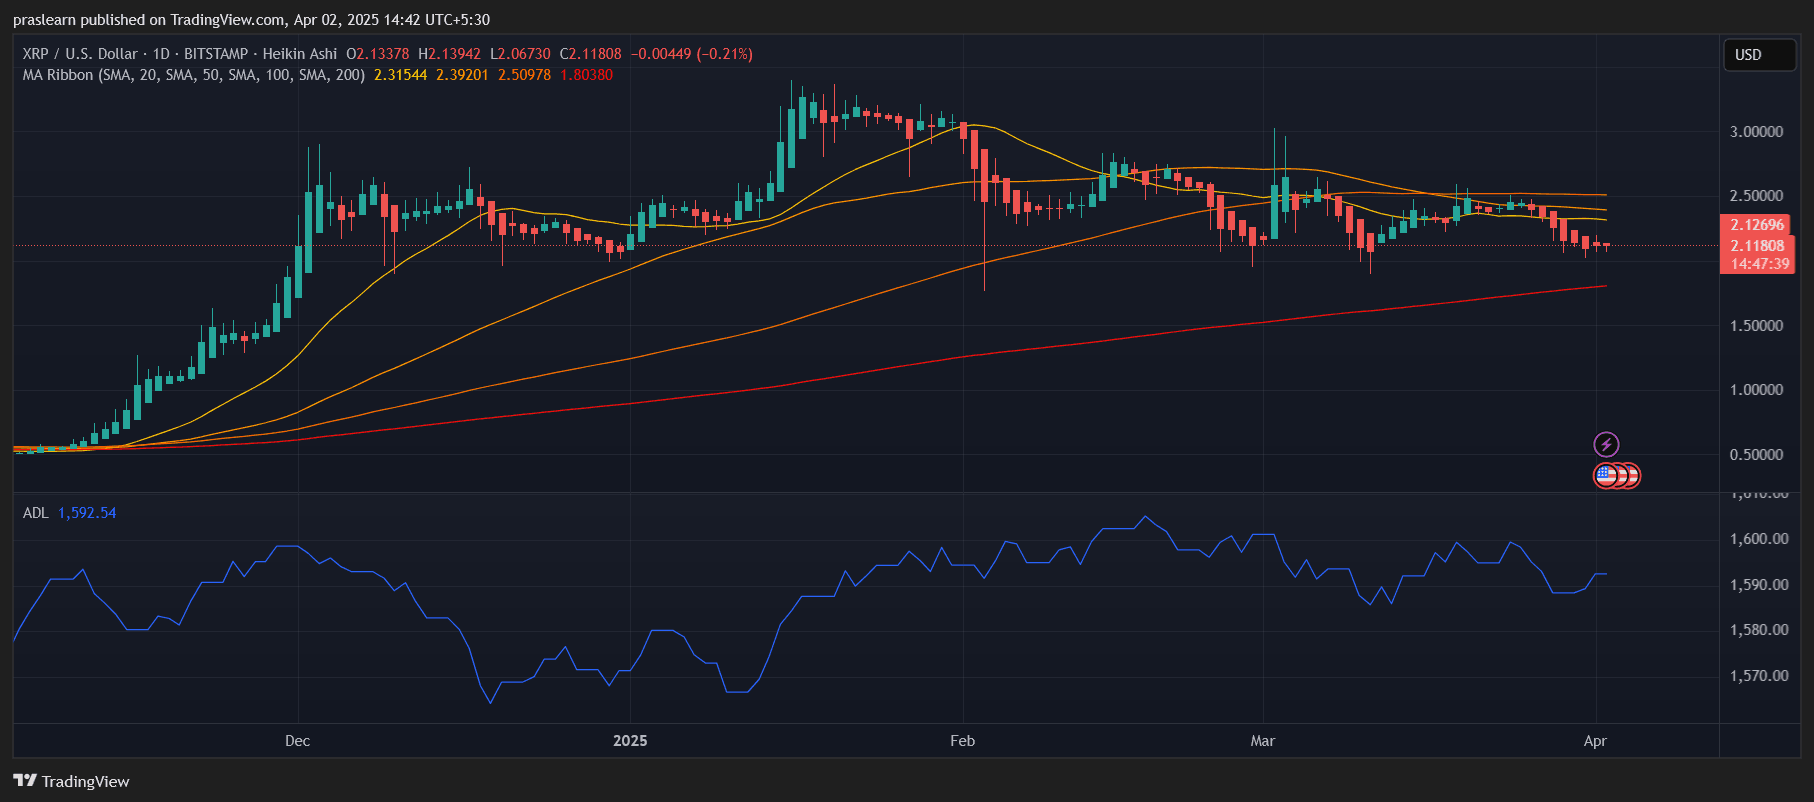
The XRP/USD daily chart (Heikin Ashi format) showcases a fading bullish momentum transitioning into a slow, grinding downtrend. Heikin Ashi candles are particularly useful here because they smooth out volatility and expose the underlying trend strength more clearly than traditional candles. The recent series of smaller-bodied red candles suggests weak selling pressure, rather than a heavy sell-off — a clue that the market might just be cooling, not collapsing.
Adding to the bearish bias, XRP has consistently traded below the 20-day and 50-day Simple Moving Averages (SMAs) for the past few weeks, showing that short-term momentum has turned against the bulls. The 100-day SMA is acting as mid-range resistance, while the 200-day SMA — still far below — could act as the final line of defense before a deeper drop ensues.
What Are the Indicators Telling Us?
The chart employs a MA Ribbon with 20, 50, 100, and 200 SMAs to gauge trend strength. Here's what they reveal:
- 20 SMA (2.315) and 50 SMA (2.392) are now above the price, confirming a short-term bearish structure.
- 100 SMA (2.509) is also overhead, reinforcing resistance.
- 200 SMA (1.803) is still below price and could provide strong support if XRP drops further.
This layered resistance structure indicates that XRP price would need significant bullish volume to break out cleanly above $2.40 again.
The Accumulation/Distribution Line (ADL), currently hovering around 1,592, shows a flattening trajectory. This suggests neither strong accumulation nor distribution is occurring — a sign of uncertainty among investors. For bulls to take back control, we would need to see a rise in the ADL, confirming smart money is buying the dip.
Will XRP Hold Its Ground or Fall to the 200-Day SMA?
XRP Price is hovering just above the $2.11–$2.13 zone, which aligns closely with the Heikin Ashi support area and the early March lows. This support is fragile — a decisive break below could trigger a retest of the 200 SMA around $1.80, which would be a key psychological and technical level. On the upside, bulls need to reclaim the $2.40 zone to even think about regaining upward momentum.
XRP Price Prediction: What Comes Next?
Given the current structure, XRP appears to be coiling for a larger move. If bulls defend the $2.10–$2.00 support and volume returns, XRP could attempt a breakout toward $2.50, and if momentum builds, retest $2.85–$3.00 highs from earlier this year. However, if selling pressure increases and the 200 SMA fails to hold, we could see a drop toward $1.60–$1.50, forming a deeper consolidation range for Q2.
XRP News Today: Final Thoughts
XRP price is at a crossroads. The indicators point to a slowing bearish trend with neutral accumulation signals — meaning a big move is likely brewing. Keep an eye on the 200 SMA and watch for a decisive breakout above the 50-day SMA before turning bullish. Until then, caution is warranted, and swing traders may find range-bound opportunities while long-term holders watch the $2.00 mark like a hawk.