Date: Fri, April 18, 2025 | 05:58 AM GMT
The cryptocurrency market has continued to face strong headwinds in 2025. Ethereum (ETH), widely seen as the bellwether of the space, posted a dismal Q1 with a staggering 45% loss—its worst start to a year since 2018. This bearish sentiment has spilled over into high-growth sectors, including AI-focused tokens like Bittensor (TAO), which has declined nearly 42% year-to-date.
Yet amid the fear and uncertainty, TAO is showing some encouraging technical signs. The token has climbed over 10% today, suggesting that the bulls may be starting to regroup. Could this mark the beginning of a larger recovery?
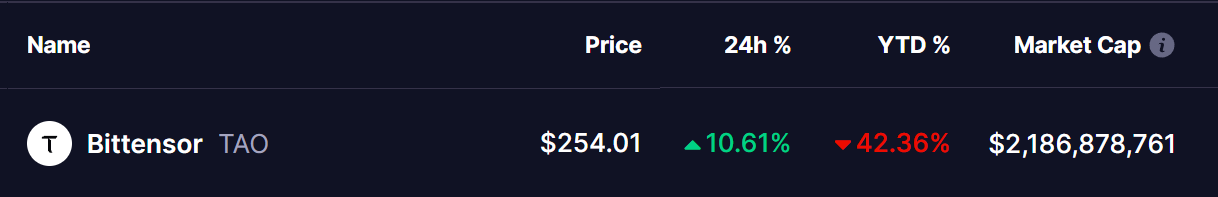 Source: Coinmarketcap
 Double Bottom Pattern Hints at Recovery
A closer look at the weekly chart reveals a promising technical formation—a double bottom pattern, a bullish reversal signal that often emerges at the end of prolonged downtrends.
The first bottom of this pattern formed back in March 2024 after TAO was rejected near $765, initiating a steep correction. After bouncing sharply, the token rallied over 344%, peaking near $744 in December. However, that high was short-lived, as TAO retraced nearly 77.8%, finding crucial support again around the $167 mark—marking the second bottom.
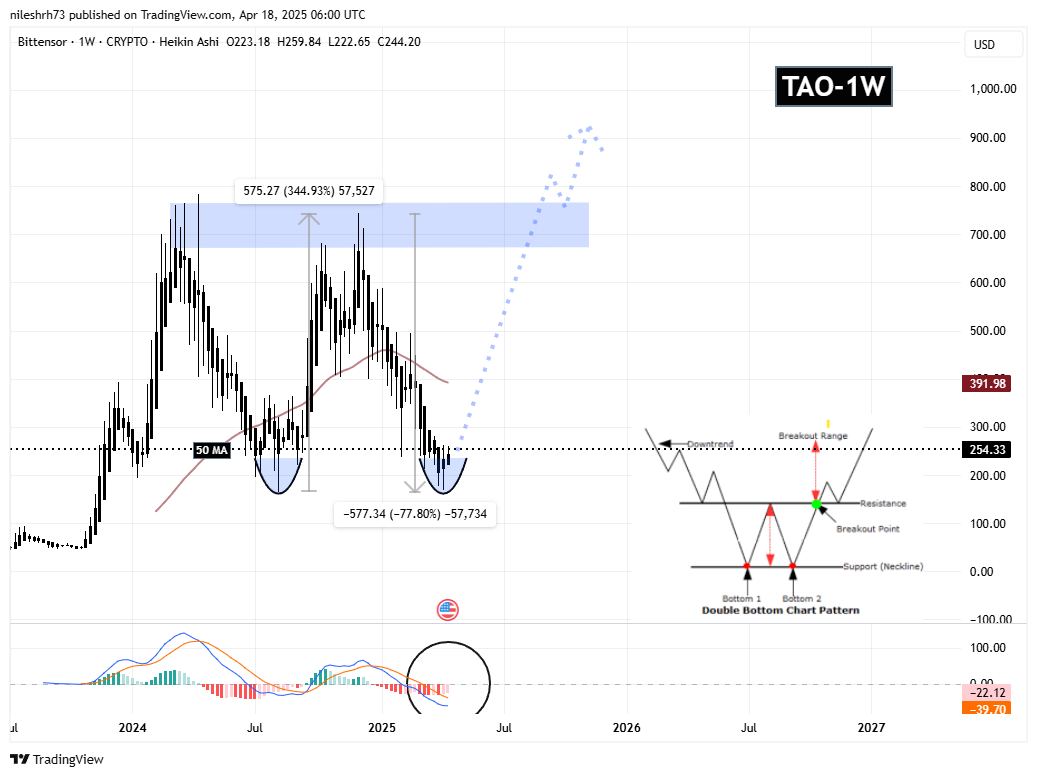 Bittensor (TAO) Weekly Chart/Coinsprobe (Source: Tradingview)
 This second touch of support appears to have triggered a reaction, as TAO now trades near $254, reflecting growing buying interest at the key demand zone.
From an indicator perspective, the MACD (Moving Average Convergence Divergence) on the weekly timeframe is beginning to curl up, hinting at a potential bullish crossover. This could signal an early momentum shift, aligning with the price structure on the chart.
The next immediate target for bulls is the 50-week MA, currently sitting around $391. A confirmed breakout above this moving average would be a significant signal of trend reversal and could open the doors for a retest of the neckline resistance at $743—a major level that, if breached, would complete the double bottom pattern and potentially launch a new bullish phase.
Final Thoughts
TAO has shown resilience by holding key support and printing a potentially powerful reversal pattern. While the path to full recovery remains uncertain, the current structure is offering bulls a technical foundation to build on. Traders and long-term holders alike should monitor the price action around $391 and $743, as these levels may dictate the next major move.
The broader market still remains cautious, but TAO is giving reasons for optimism—especially if bulls can carry the momentum forward and confirm the pattern breakout in the coming weeks.
Disclaimer: This article is for informational purposes only and not financial advice. Always conduct your own research before investing in cryptocurrencies.