Date: Fri, April 18, 2025 | 09:20 AM GMT
The cryptocurrency market has been under intense selling pressure recently, with Ethereum (ETH) posting its worst Q1 since 2018, sliding more than 45%. That bearish wave swept across the altcoin sector — and the Artificial Superintelligence Alliance (FET) token wasn’t spared, tumbling over 60% in the last 90 days.
But there’s a shift in momentum — and FET is now flashing signs of a potential trend reversal.
The AI-focused token has jumped 9% today, breaking a key technical pattern that could mark the start of a broader recovery rally.
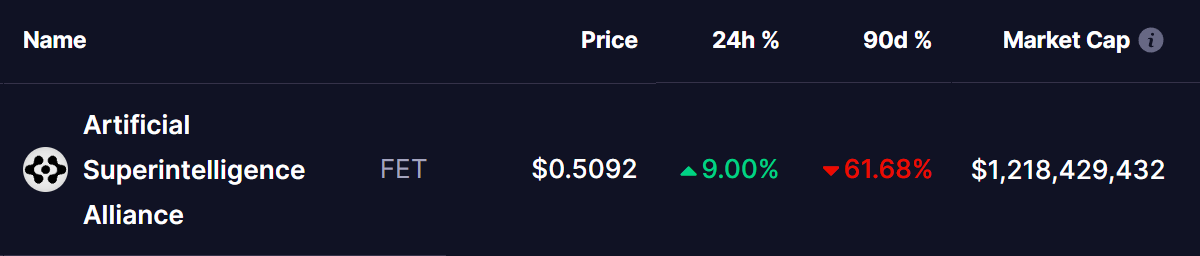 Source: Coinmarketcap
 Harmonic Pattern Signals a Potential Turnaround
FET’s price action has just completed a Bullish Shark Pattern, a classic harmonic setup known for signaling the end of downtrends and the beginning of new upswings. The formation’s final “D” point developed near the $0.34 support zone, aligning closely with major Fibonacci levels.
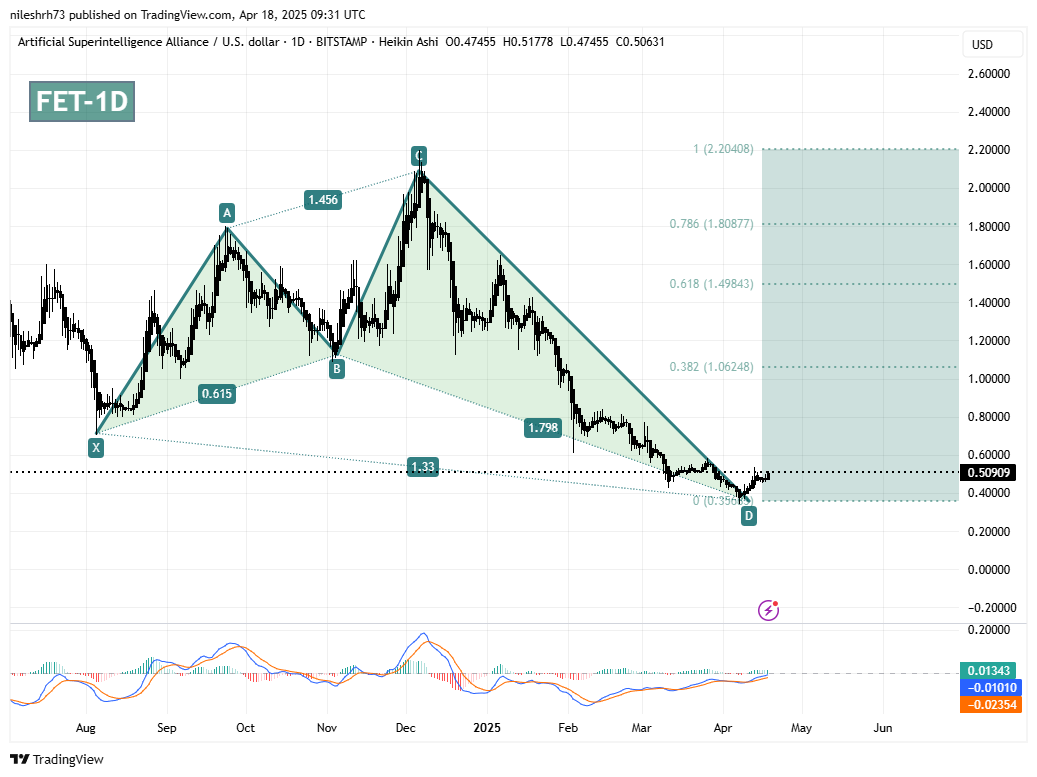 FET Daily Chart/Coinsprobe (Source: Tradingview)
 FET’s downward slide began in early December 2024, after failing to hold above the $2.20 mark. From there, the token dropped more than 74%, finding a bottom around $0.34 on April 7. Since then, FET has staged a steady recovery — and recent breakout above the $0.42 neckline confirms the pattern and hints at renewed bullish pressure.
If buyers continue to step in, the following Fibonacci retracement levels are in focus as potential price targets:
- 0.382 Fib – $1.06
- 0.618 Fib – $1.49
- 0.786 Fib – $1.80
- Full Projection (1.0 Fib) – $2.20
With $0.46 now acting as short-term support, holding this level will be crucial for bulls aiming to push higher.
Outlook: Can FET Sustain the Climb?
After a harsh correction, FET may finally be turning the corner. The breakout from the harmonic structure and improving momentum indicators are both strong technical signals. If FET can clear resistance near the $0.70–$1.00 range, the rally could accelerate quickly.
However, as with all patterns, follow-through is key. Traders should look for volume confirmation and keep a close eye on broader market sentiment. Still, the setup is looking favorable — and FET could be gearing up for a powerful rebound.
Disclaimer: This article is for informational purposes only and does not constitute financial advice. Always do your own research before making any investment decisions.