Solana price today is trading near $173.65, following a sharp breakout that carried price from the $145 support zone toward a critical confluence resistance near $180. This recent rally has reignited bullish sentiment across the market, but with signs of exhaustion emerging on lower timeframes.
What’s happening with Solana’s price?
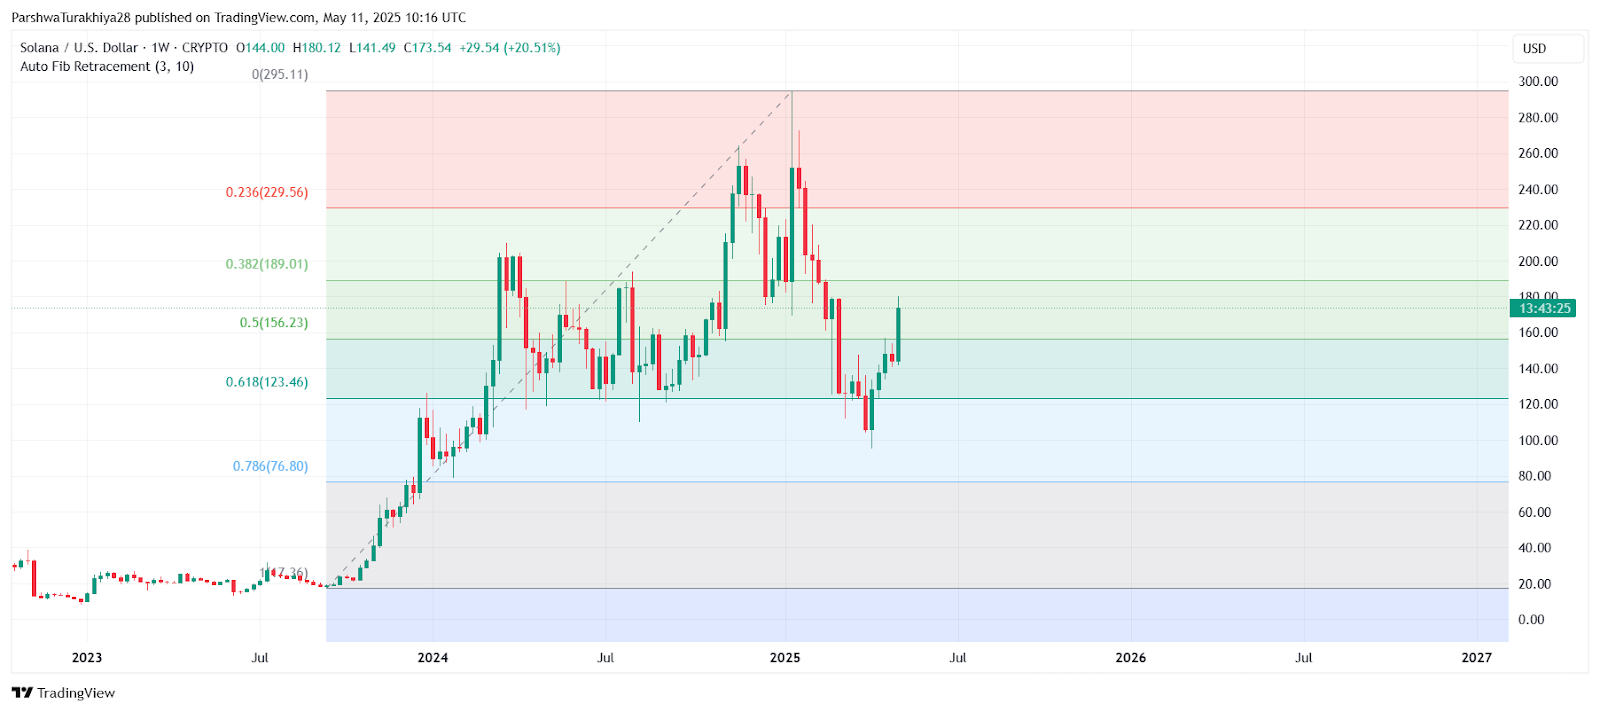
After weeks of consolidation, Solana price broke decisively above a multi-month descending trendline on the daily chart, triggering a swift move from the $140–$145 zone to retest the $180 psychological barrier. This move aligns with the 0.5 Fibonacci retracement level ($156.23) from the November 2023 high to April 2025 low, which acted as a springboard for the breakout.
 Solana price dynamics (Source: TradingView)
 On the weekly chart, Solana price action is pushing into the 0.382 retracement level near $189. This zone served as a major distribution point during Q4 2024 and could now pose heavy resistance unless bulls reclaim it with volume.
Intraday Reversal Signs: Why Solana price going down today?
 Solana price dynamics (Source: TradingView)
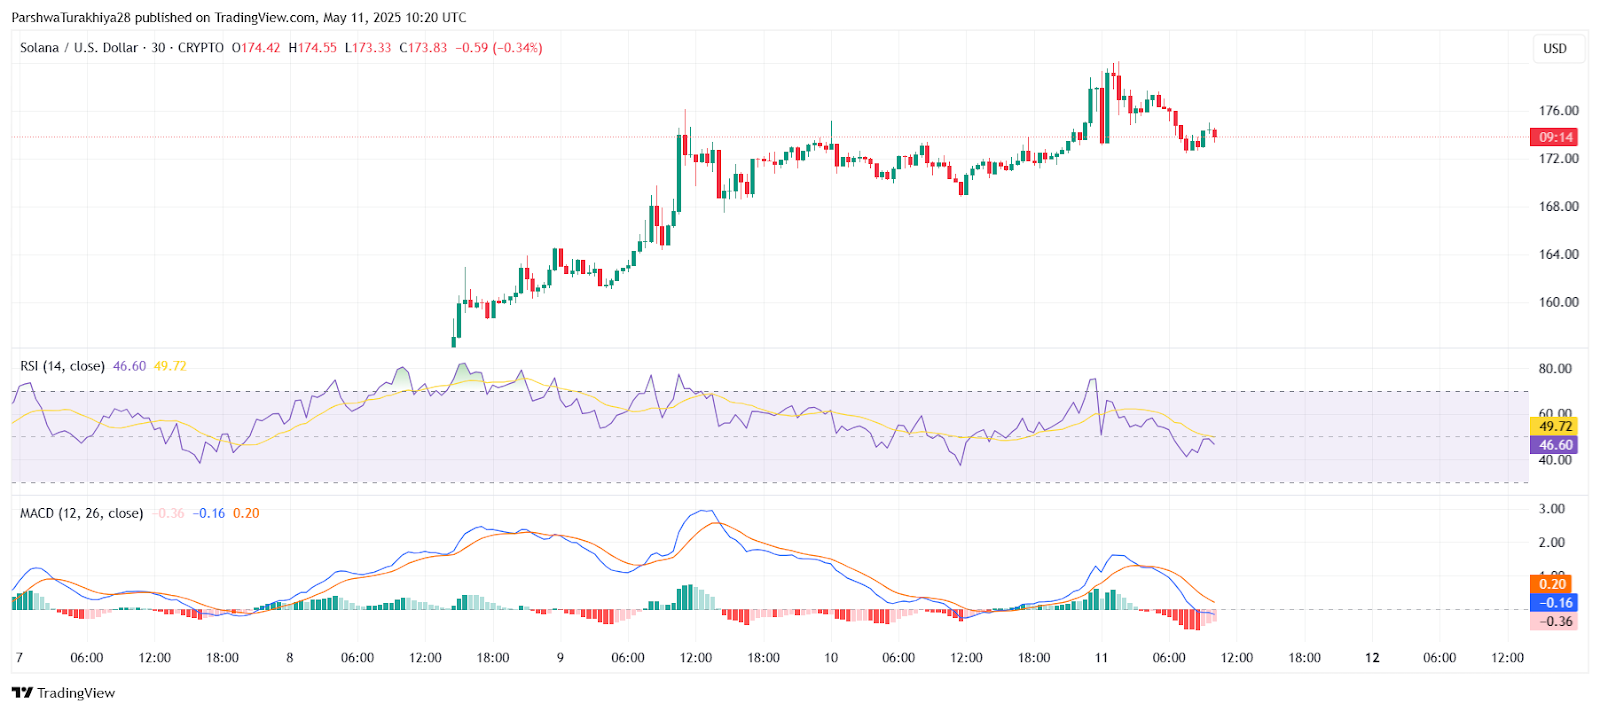
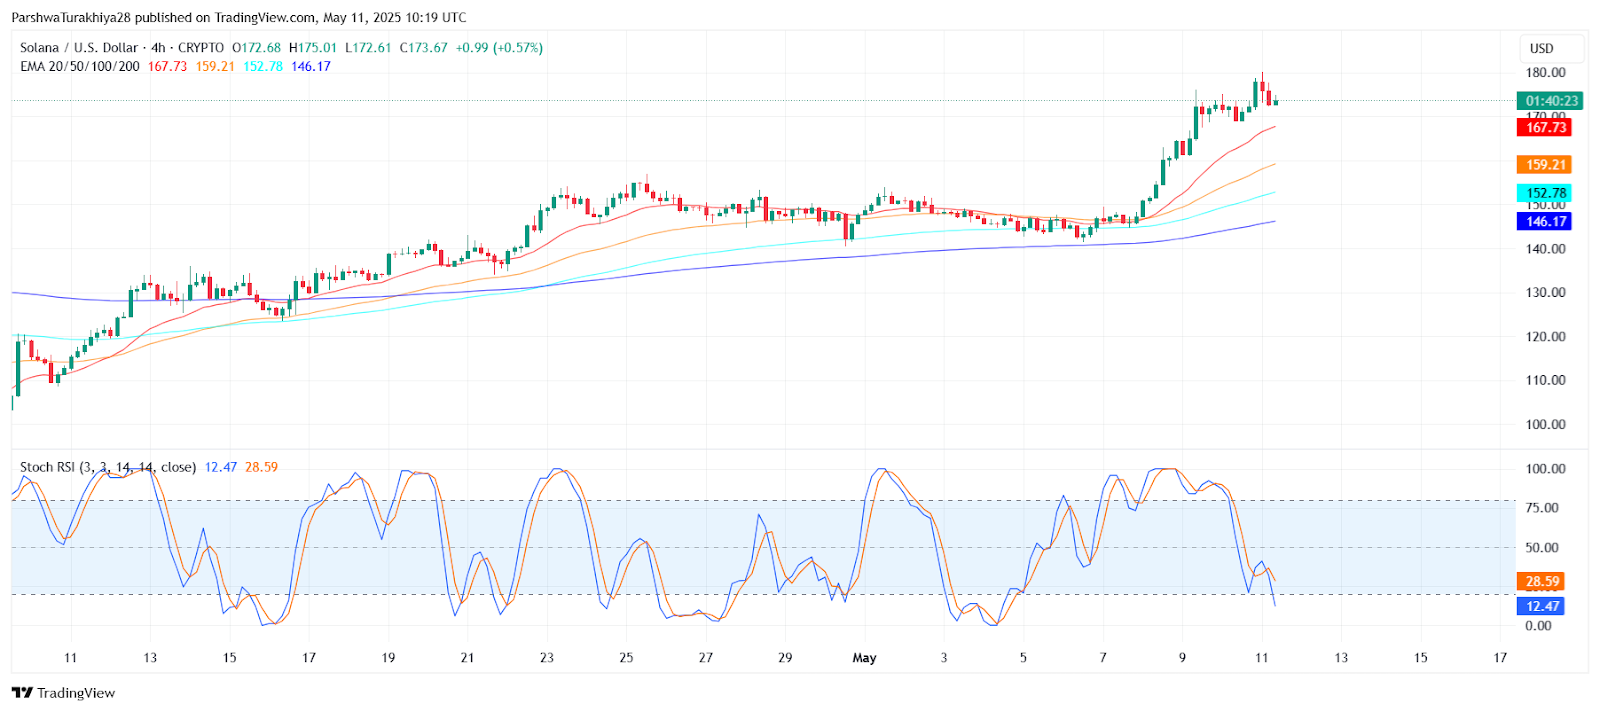
 The 4-hour chart reveals early signs of exhaustion. The Stochastic RSI has crossed back down from overbought levels and is now below 20, indicating weakening short-term momentum. Similarly, the RSI on the 30-minute chart has dipped below 50, and MACD has printed a bearish crossover with declining histogram bars.
 Solana price dynamics (Source: TradingView)
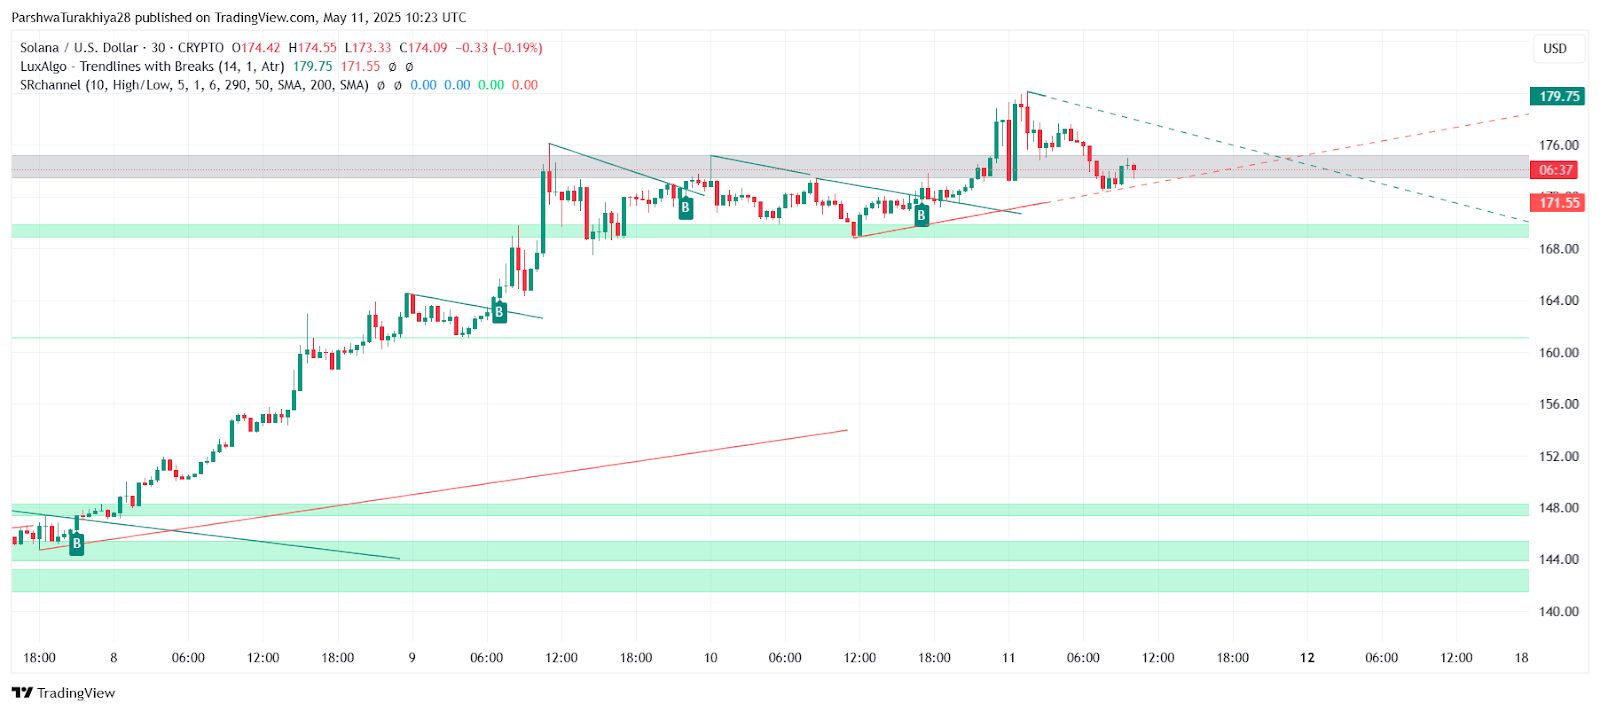
 Price has also pulled back after failing to hold above $175. Strong resistance is seen near $179.75, and unless Solana can flip this level decisively, we may see a near-term retracement toward the $167–$170 support range, which aligns with the EMA-20 and 4-hour Bollinger mid-band.
Classic Pattern Breakout Adds Fuel to Solana’s Momentum
 Solana price dynamics (Source: TradingView)
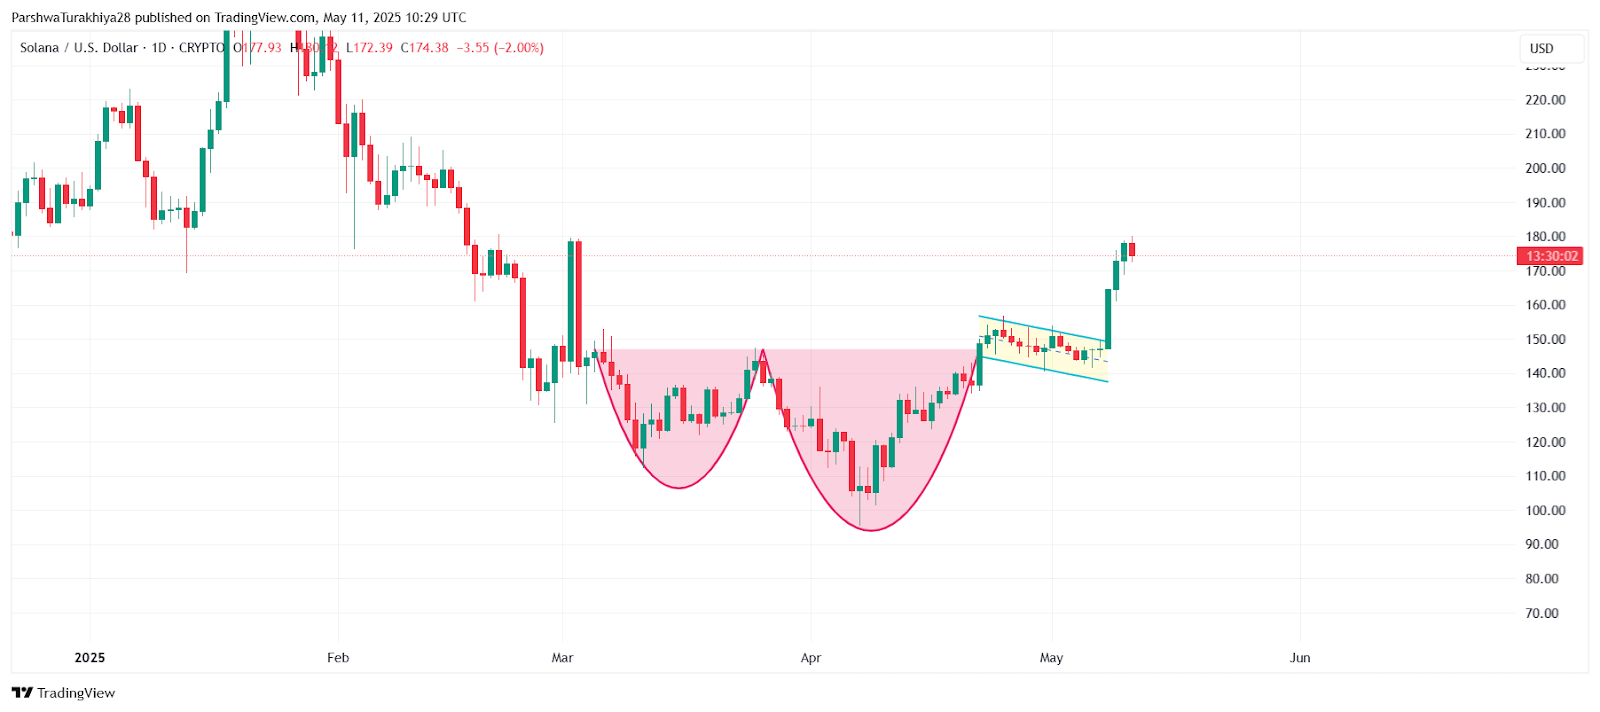
 One of the more notable developments on the daily chart is the breakout from a classic cup and handle pattern, which had been forming over the last several weeks. The rounded base between March and April established a strong bullish foundation, and the handle’s downward-sloping consolidation was followed by a clean breakout in early May.
This bullish continuation structure reinforces the strength behind the recent Solana price spikes, signaling that the current trend has technical backing beyond just short-term speculation. With price now holding above the neckline breakout near $156–$160, the measured move from this pattern gives Solana a theoretical upside projection toward the $190–$200 range, aligning closely with key Fibonacci resistance at $189.
Solana Price Outlook for May 12
 Solana price dynamics (Source: TradingView)
 The Solana price update for May 12 will largely depend on how price behaves around the $171–$175 short-term zone. If this level holds, buyers may attempt another breakout above $180, targeting $189 and potentially $200, which aligns with the upper trendline of a large ascending channel.
However, if price closes below $171, short-term bearish momentum could extend toward the $159–$161 support area. Below that, the 100 EMA at $152.78 serves as the next critical pivot.
Despite the pullback, overall Solana price volatility remains bullishly tilted. The daily structure has flipped from lower highs to a potential breakout formation, and weekly candles show strength following the rejection wick in late April.
Key Levels to Watch:
| Timeframe | Support Zones | Resistance Zones | Indicators Signal |
| Daily | $156 / $144 | $180 / $189 | EMA flip bullish, trendline breakout |
| 4-Hour | $171 / $167 | $179.75 | Stoch RSI oversold, MACD weakening |
| Weekly | $156.23 / $123.46 | $189.01 / $229.56 | Above 0.5 Fib, room to extend higher |
Traders should monitor whether Solana price today holds above the $171–$173 area. A bullish defense here could open doors for a retest of $180 and beyond, while a breakdown might invite further cooling. The broader trend favors bulls, but Solana price action on May 12 will hinge on intraday support stability and broader crypto sentiment.
Disclaimer: The information presented in this article is for informational and educational purposes only. The article does not constitute financial advice or advice of any kind. Coin Edition is not responsible for any losses incurred as a result of the utilization of content, products, or services mentioned. Readers are advised to exercise caution before taking any action related to the company.