Key Insights:
- Whale transactions over $100K peaked at 720 on May 12, matching PEPE’s price top at $0.000015.
- PEPE futures Open Interest nears $584M with 72% of Binance traders holding long positions.
- A confirmed double top pattern may lead PEPE to drop 25% to $0.00001063 if $0.00001274 support fails.
After a strong 100% rally last week, Pepe Coin shows early signs of weakening. A sharp rise in large-value whale transactions and bearish chart patterns has raised concerns about a possible market top. While retail sentiment remains strongly bullish, recent technical signals and on-chain metrics suggest caution. Investors are watching closely to see if Pepe Coin’s momentum can hold or reverse sharply.
Whale Transactions Show Signs of Profit-Taking
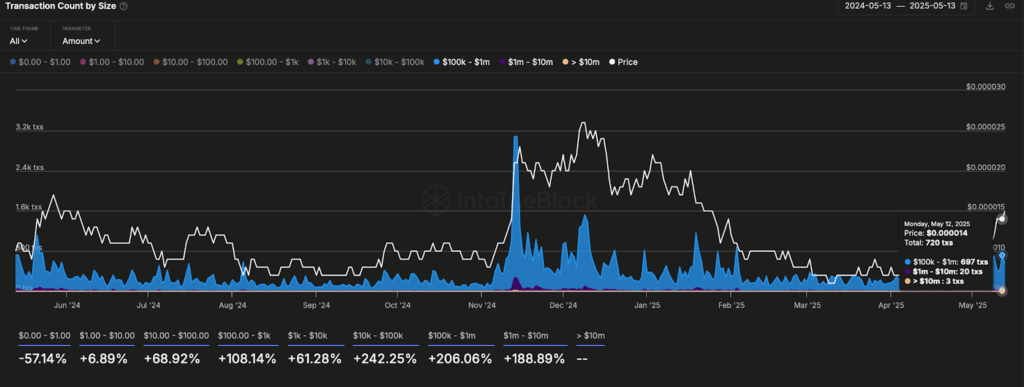
Whale activity has increased noticeably, with IntoTheBlock data showing a surge in $100K+ transactions on May 12.
On that day, 720 transactions above $100K were recorded, which coincided with Pepe Coin’s local peak of $0.000015. These spikes in whale transactions often occur when large holders start booking profits after strong price movements.
Past patterns suggest such increases usually happen near price tops. Similar activity was seen during May, November, and December 2024, each followed by price pullbacks. Generally, the 800 transaction level signals heavy profit-taking. Though not yet at this level, the current activity could mean whales are reducing exposure.
 Source: IntoTheBlock
 The combination of whale selling and slowing price momentum could lead to short-term volatility. This behavior is often a warning that larger investors may expect a correction or weaker growth ahead.
Double Top Pattern and Key Support Levels
Pepe Coin rose from $0.0000075 to $0.000015 between May 6 and May 12, marking a 100% increase. However, the coin failed to break the $0.000015 resistance, leading to a sideways pattern. The price now trades closer to the $0.00001274 baseline.
Technical charts are creating a double top reversal, which is a typical bearish pattern. However, if the coin breaks the $0.00001274 neckline, then the pattern will be complete. If the prices do close below this level within the next four hours, then the setup will be confirmed and the prices may move lower.
 Source: TradingView
 The potential downside of the double top is 25%, with a target at $0.00001063. This is determined by taking the pattern height and deducting it from the neckline level. This volume of decline would wipe out most of last week’s gains.
Measurements such as the RSI are already flashing weakness. The RSI has trended lower out of the overbought region, pointing to the loss of momentum. The MACD lines are bearish with a cross under, confirming higher pressure from bears.
Open Interest and Trader Sentiment Show Overexposure
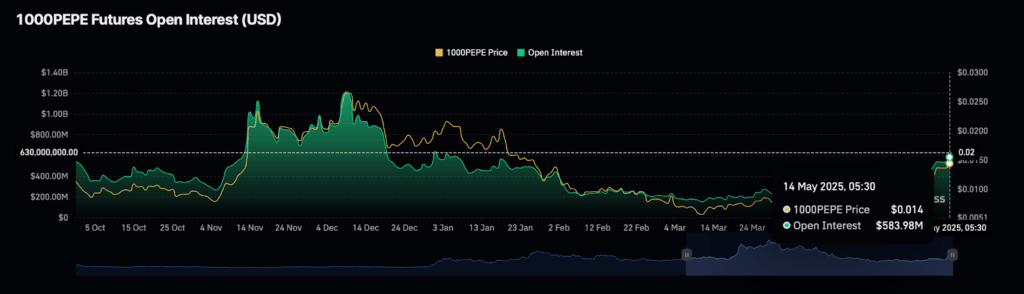
The open interest in Pepe Coin futures is also high. As of the 14th of May, data reveals it at around $583.98 million, close to a record high level. This is indicative of increased activity of the traders but also raises the issue of long-position overexposure.
Binance futures data reveals that 72% of the traders are long, resulting in now long/short ratio of 2.57. This indicates that the prevailing bullish bias of retail traders is strong. High long interest can help rallies, but at the same time increase the likelihood of liquidations of longs if prices move lower.
 Source: CoinGlass
 Trends recorded in history indicate that when Open Interest rises sharply, without corresponding price rises, corrections are likely. In the middle of December in 2024, a similar spike in Open Interest triggered a sharp pullback in the market.
If Pepe Coin is unable to maintain this level above key support, these leveraged positions may be dumped in a flash.
If support holds at current levels, it could lead to a bounce. However, if the price falls and triggers a wave of liquidations , the correction could deepen. This would align with the projected target of $0.00001063 from the double top pattern.
Head and Shoulders Pattern Signals More Downside
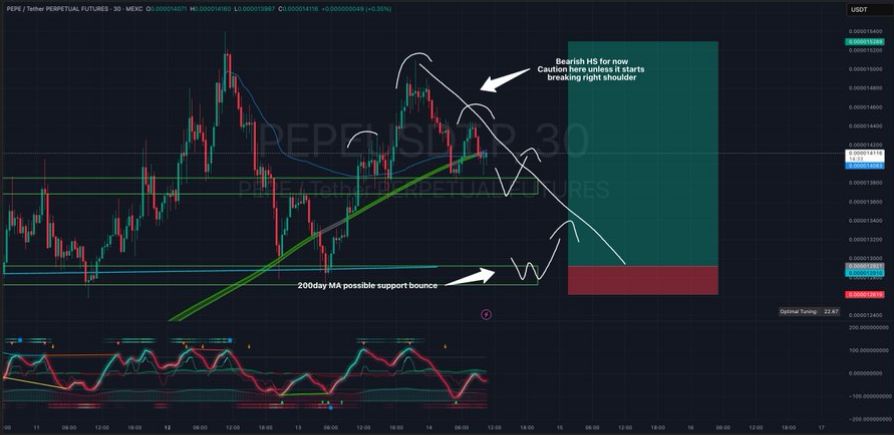
Short-term charts now display a bearish Head and Shoulders pattern. This configuration reveals the left shoulder, head, and right-shaping shoulder on the PEPE/USDT 30-minute chart. The neckline support is still undergoing a test.
If price breaks below the neckline, then a more severe decline is likely. Analysts also note a possible bounce at the 200-day moving average and potential source of support for the price in the short-term. However, a drop below this line could add to the downside risk.
 Source: X
 Momentum oscillators, such as the Stochastic RSI, show bearish divergence. This adds to concerns that the recent rally may be ending. Combined with rising whale activity, these technical signals point to caution for short-term traders.
On the whole, with a bounce still possible, Pepe Coin’s rising whale transactions, bearish chart formations, and high open interest points to a test. The next few trading sessions will probably decide whether a rally can continue or if a deeper correction starts.