The Pi Network price today remains under pressure as the token continues to extend its multi-week downtrend below key exponential averages and descending resistance lines. At the time of writing, Pi Network price is trading near $0.638, having shed over 1.5% in the past 24 hours. The ongoing weakness signals a lack of bullish conviction amid broader market indecision, as PI struggles to reclaim its short-term support zones.
What’s Happening With Pi Network’s Price?
 Pi Network price dynamics (Source: TradingView)
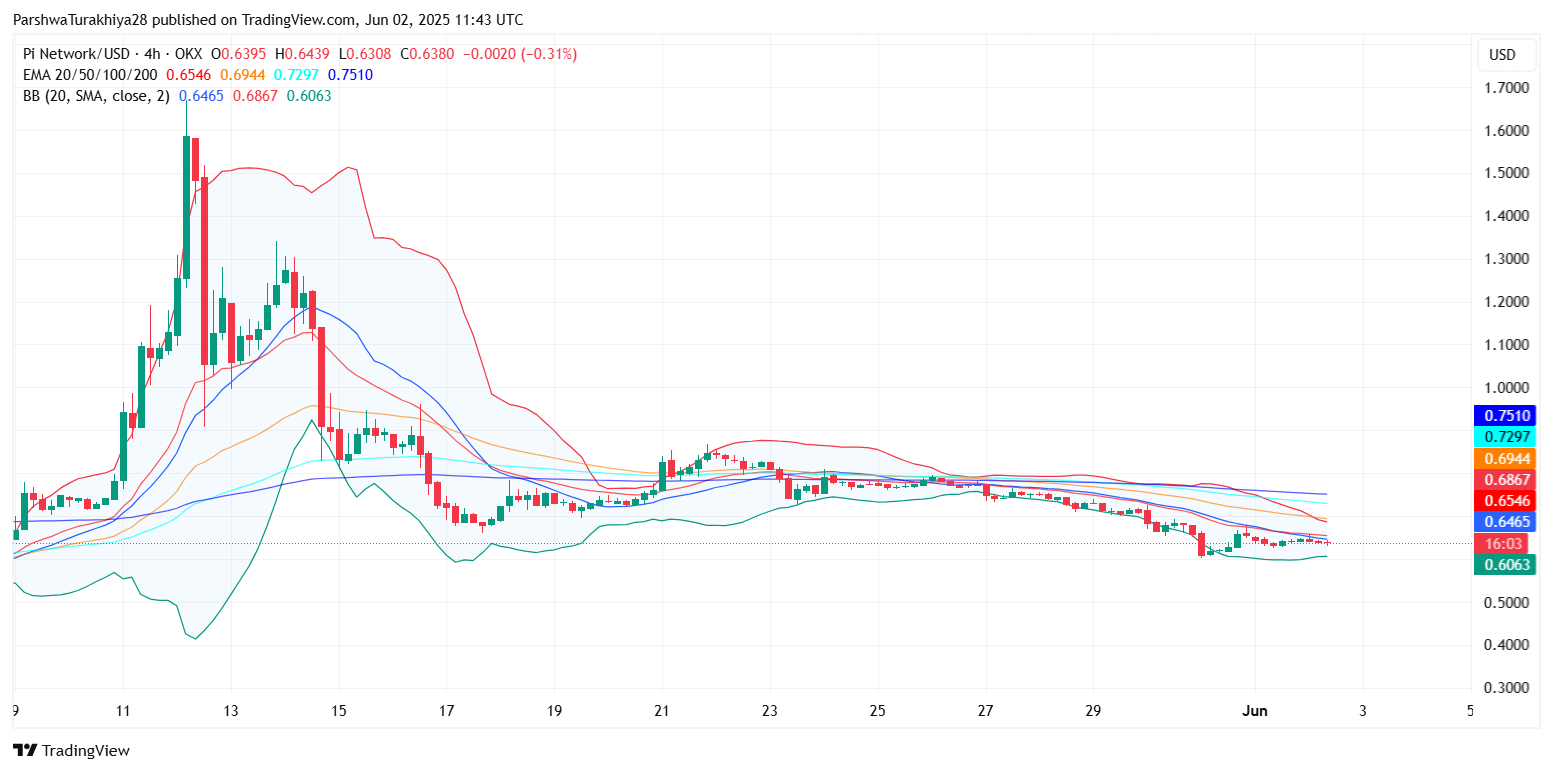
 The recent Pi Network price action paints a cautious technical outlook. On the daily chart, price continues to trade beneath the key $0.6600–$0.6850 zone, where repeated breakdowns have confirmed strong overhead resistance. A bearish descending triangle pattern has formed, stretching from mid-May, with the lower support line holding around $0.6200. This region is now a critical level for bulls to defend.
The broader trend remains negative, as price trades below the 20/50/100/200 EMA cluster. Each of these moving averages—especially the 50 EMA near $0.686—is acting as a dynamic ceiling, reinforcing bearish structure. Until PI closes above $0.700 on the daily timeframe, bullish recovery signals remain unconvincing.
Pi Network Price Slides Within Bearish Channel
 Pi Network price dynamics (Source: TradingView)
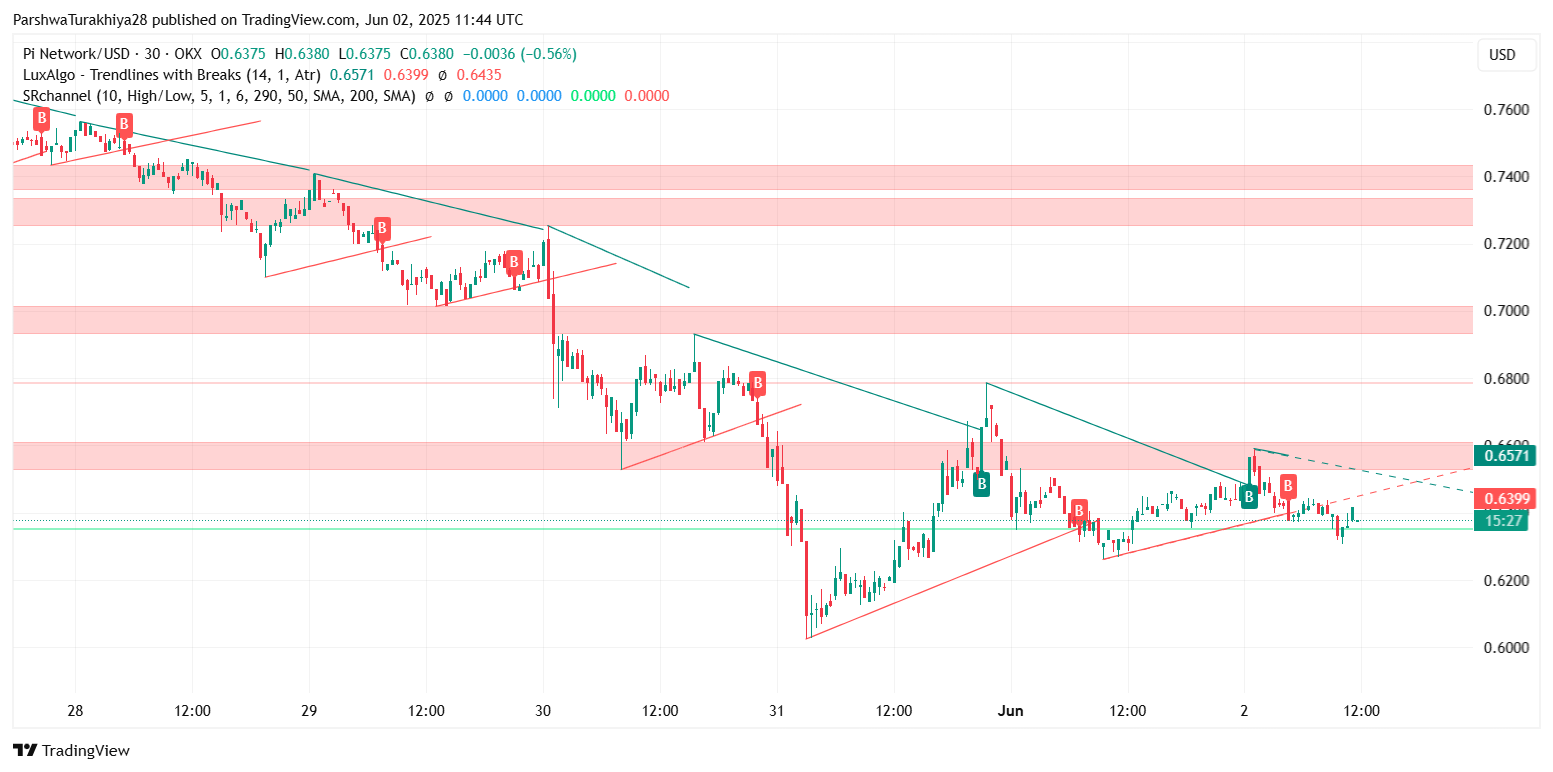
 On the 4-hour chart, Pi Network price volatility has tightened into a descending wedge, with the upper resistance currently aligning near $0.657 and lower support base sitting around $0.602. The failure to hold the $0.660–$0.670 breakout zone late last week led to renewed selling, and price has since failed to sustain above the Bollinger Band midline.
Bollinger Bands are now slightly squeezed, suggesting declining volatility and potential for a directional move. However, price remains below the 20-period moving average ($0.646) and is testing the lower band ($0.606), hinting at further downside risk unless reclaimed soon.
Meanwhile, the Pi Network price update shows that EMAs across all four major timeframes remain sloped downward, with the 200 EMA at $0.7510 capping any bullish push. Momentum remains weak, and a clean close above $0.660 is required to invalidate the current bearish momentum.
Momentum Indicators Signal Weak Recovery Attempts
 Pi Network price dynamics (Source: TradingView)
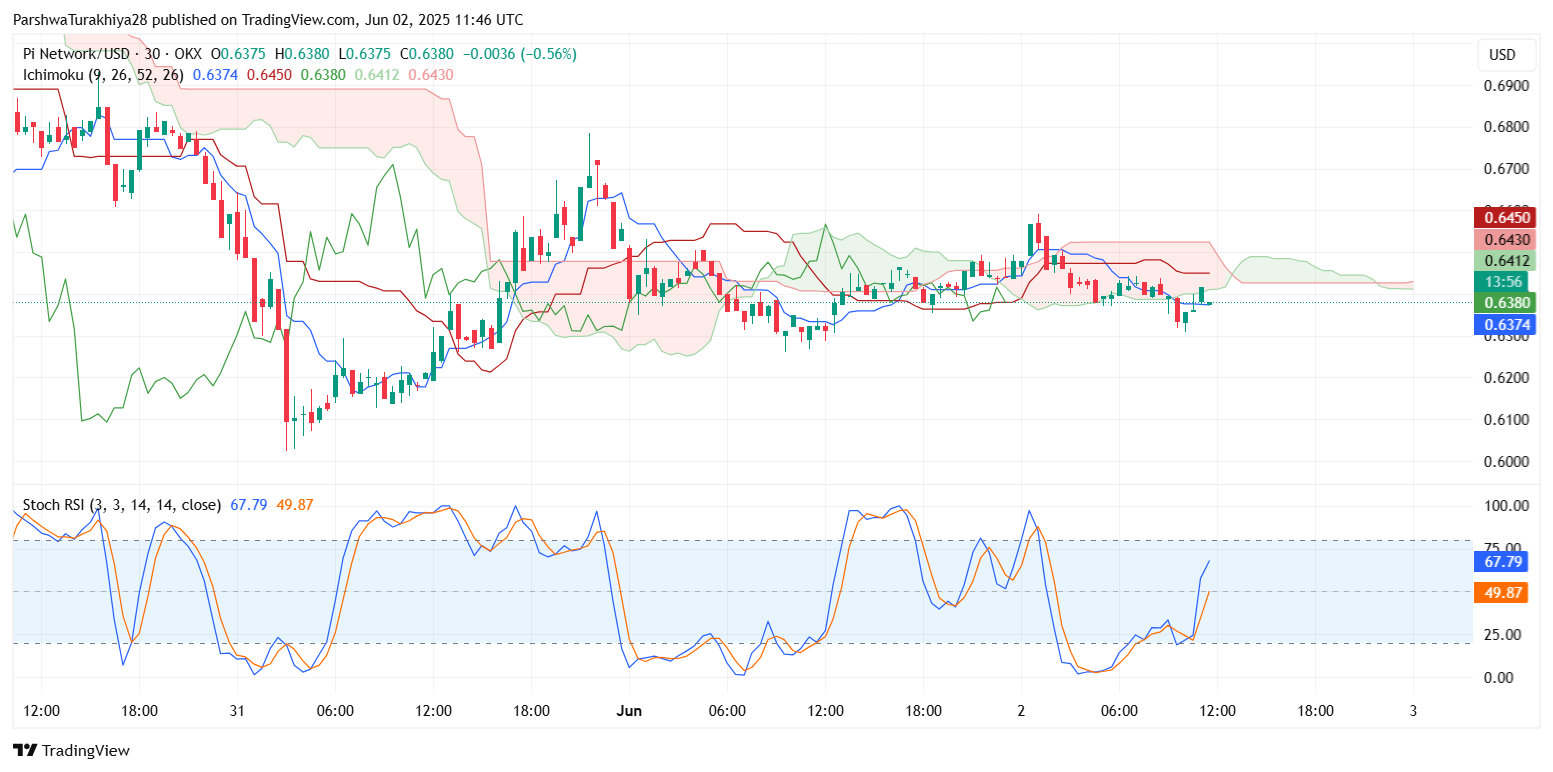
 On the 30-minute and 4-hour timeframes, RSI has bounced from oversold levels but remains capped below the neutral 50 mark. The latest Pi Network price spikes into $0.655–$0.657 have been rejected swiftly, confirming supply pressure just below trendline resistance.
The MACD histogram shows signs of weakening bullish momentum, with recent bars declining toward the zero line. A bearish crossover remains in play on the 30-minute chart, reinforcing the selling bias. Meanwhile, Chande Momentum Oscillator is still in negative territory (-19.50), further supporting the lack of immediate recovery strength.
 Pi Network price dynamics (Source: TradingView)
 On the Ichimoku Cloud chart, price action hovers at the base of the Kumo, with both the Tenkan-sen and Kijun-sen lines flattening near $0.645. The cloud remains thick and red, reflecting ongoing bearish sentiment, and the lagging span (Chikou) has yet to break above price—a key bullish confirmation level.
Why Pi Network Price Going Down Today
The primary reason why Pi Network price went down today stems from the persistent rejection at both diagonal trendline and horizontal resistance levels, especially near $0.660 and $0.686. In addition to the deteriorating structure, Pi’s inability to hold short-term moving averages or break through Ichimoku resistance clouds signals a broader lack of bullish control.
This extended downtrend is further exacerbated by the failure to reclaim prior demand zones and the continued lower-high formations. Each minor rebound has been sold into, showing that market participants lack confidence in a sustained bullish reversal at current levels.
Short-Term Forecast and Key Levels to Watch
 Pi Network price dynamics (Source: TradingView)
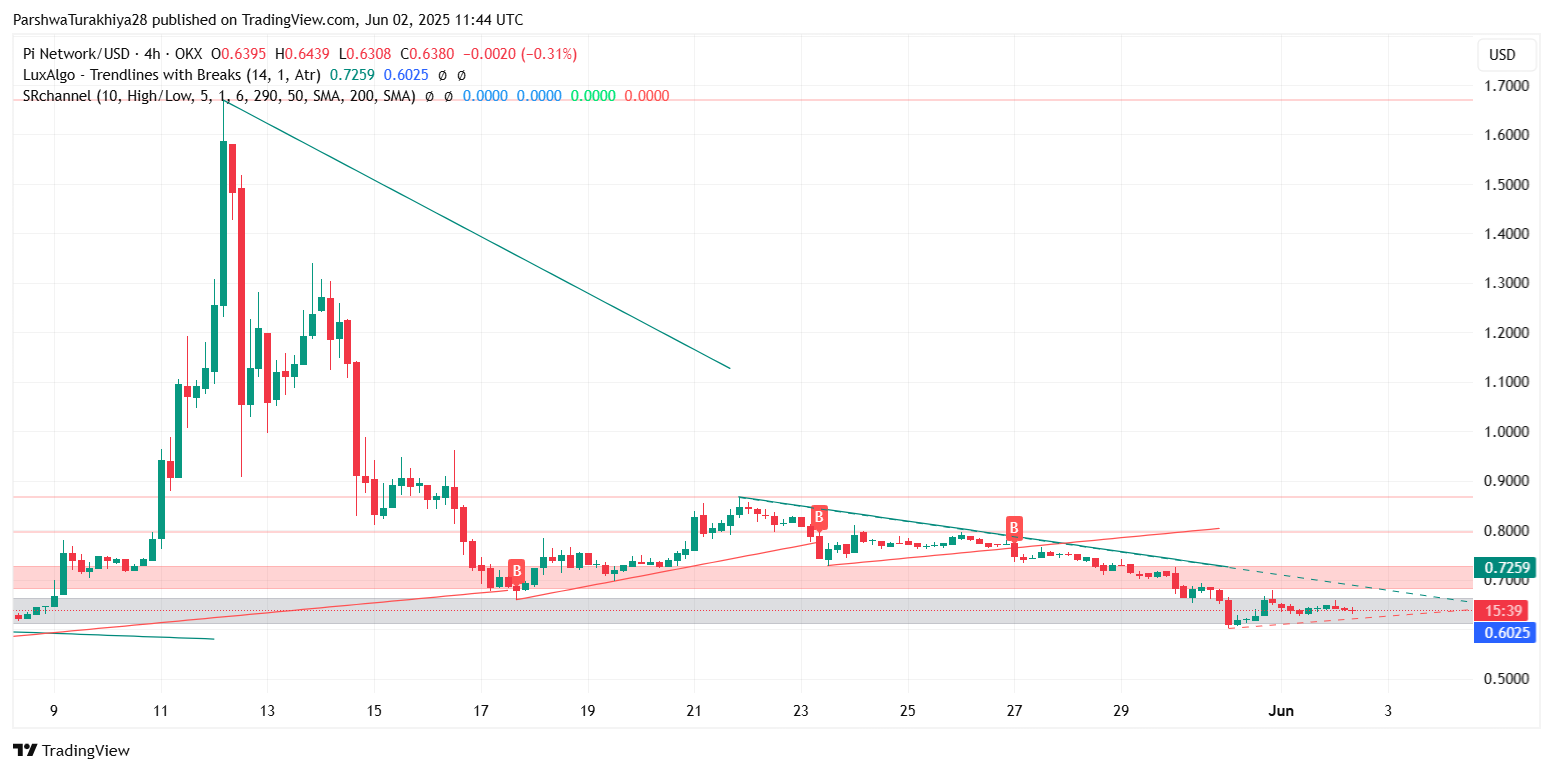
 Looking ahead, the immediate support for Pi Network price lies between $0.620 and $0.602. A breakdown below this range may accelerate losses toward the $0.580 and $0.550 zones. On the upside, any reclaim above $0.660 could open the path toward $0.686 and then $0.725, where higher timeframe resistance aligns with the descending trendline.
However, unless Pi decisively breaks above the $0.700 psychological mark and holds above the EMA cluster, the dominant structure remains bearish. Lower timeframes may see short bounces, but the medium-term direction favors sellers unless major resistance levels are reclaimed.
Forecast Table: Pi (PI) Price Prediction – June 3
| Level Type | Price Zone ($) | Remarks |
| Immediate Resistance | 0.657 – 0.660 | Lower high zone, descending trendline cap |
| Major Resistance | 0.686 – 0.700 | EMA and Ichimoku ceiling, breakout confirmation |
| Immediate Support | 0.620 – 0.602 | Last short-term defense for bulls |
| Strong Support | 0.580 – 0.550 | Historical demand zone |
| Bearish Continuation Below | 0.602 | Opens path toward $0.520–$0.500 |
The Pi Network price today remains at a crucial juncture, caught between consolidation and breakdown. Until key resistances are cleared and momentum indicators confirm trend reversal, the overall trajectory appears skewed to the downside. Traders should remain cautious, watching for potential fakeouts near the $0.660 mark, and await a confirmed breakout to validate any bullish thesis.
Disclaimer: The information presented in this article is for informational and educational purposes only. The article does not constitute financial advice or advice of any kind. Coin Edition is not responsible for any losses incurred as a result of the utilization of content, products, or services mentioned. Readers are advised to exercise caution before taking any action related to the company.