Hedera (HBAR) Gains Lose Steam as Demand For Shorts Surges
Hedera’s native token, HBAR, has bucked broader market trends by posting modest gains since the start of June. It currently trades at $0.17, up 5% during that period.
However, technical and on-chain signals suggest that this upward momentum may be running out of steam.
HBAR Defies Market Slump, But Bearish Signals Begin to Emerge
Since June 1, the HBAR token price has managed to push higher, defying the general market slump. Yet, behind this steady climb, there are growing signs that a bearish shift may be underway.
For example, readings from HBAR’s Moving Average Convergence Divergence (MACD) show its MACD line (blue) positioned below the signal line (orange) at press time, indicating a strong bearish presence in the market.
 HBAR MACD. Source: TradingView
 An asset’s MACD indicator identifies trends and momentum in its price movement. It helps traders spot potential buy or sell signals through crossovers between the MACD and signal lines.
When the MACD line is above the signal line, it indicates bullish momentum, suggesting that the asset’s price may continue to rise. Traders often see this crossover as a potential buy signal.
On the other hand, as with HBAR, when the MACD line is positioned below the signal line, it typically signals weakening bullish momentum or a potential shift toward bearish sentiment.
This crossover suggests that the asset’s short-term price movements are losing strength relative to its longer-term trend, hinting at a possible downturn ahead.
Moreover, this bearish undertone is evident in the HBAR futures market, reflected by the surging demand for short positions among traders. Per Coinglass, HBAR’s long/short ratio is at 0.95, indicating the preference for short positions among traders.
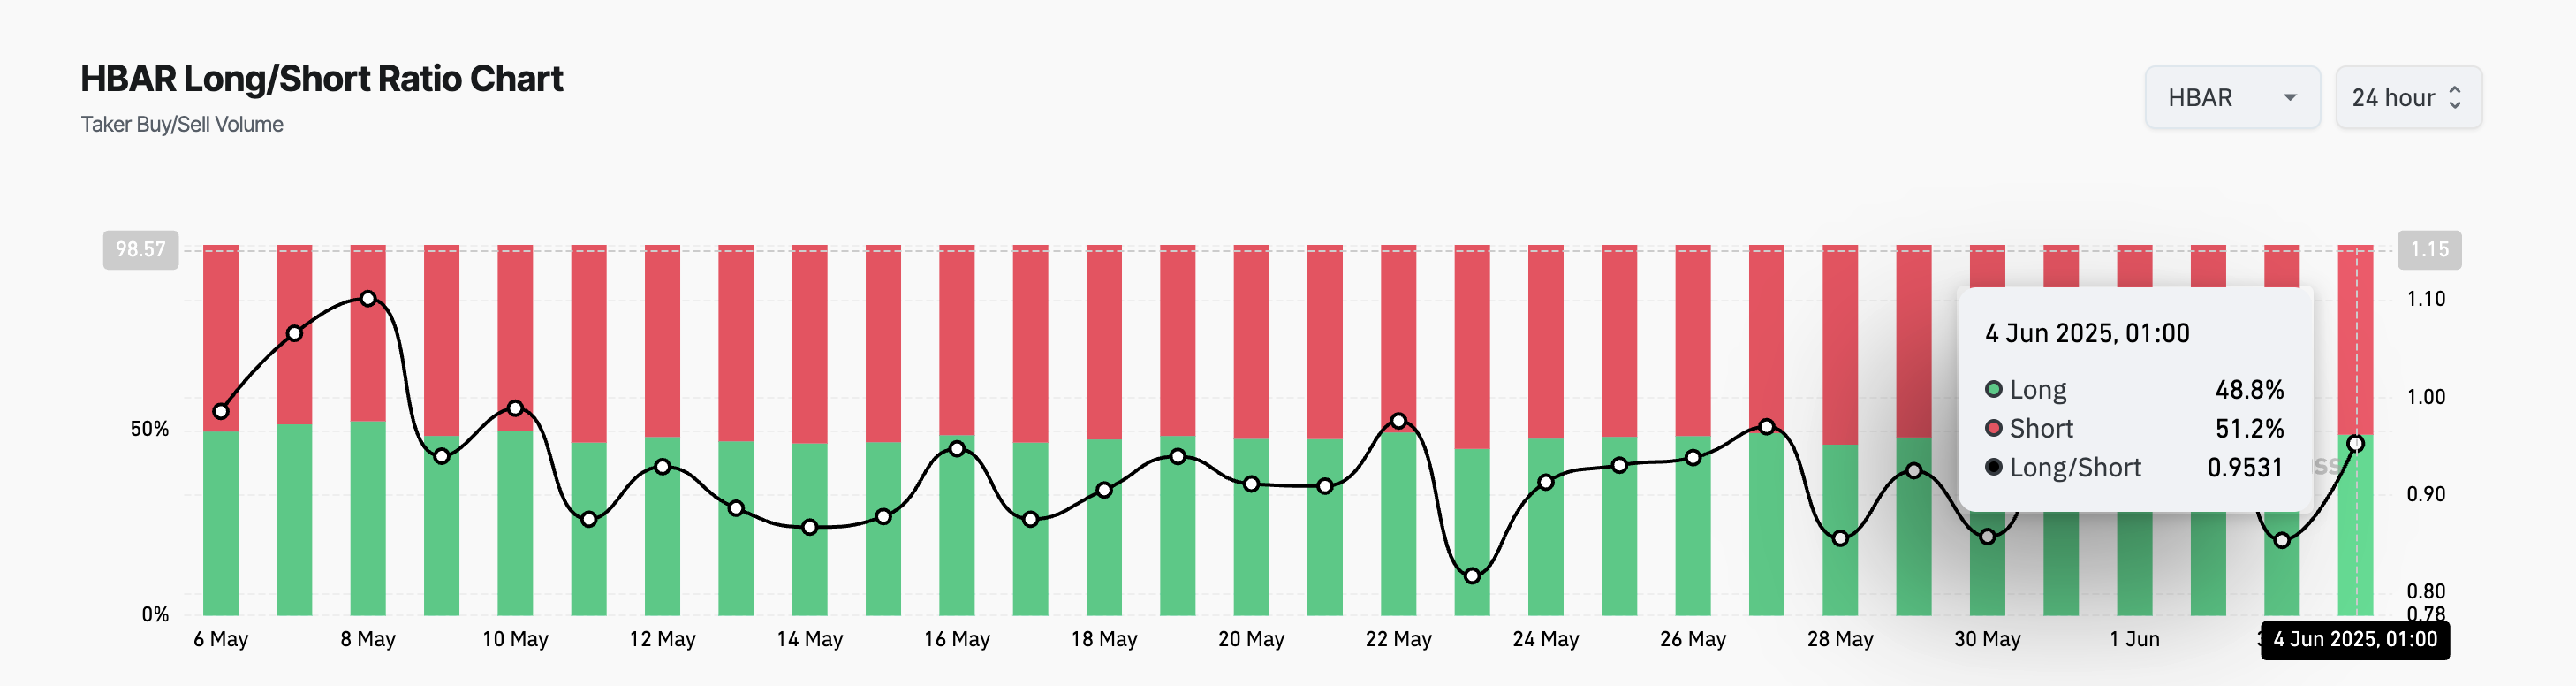 HBAR Long/Short Ratio. Source: Coinglass
 The long/short ratio measures the proportion of bullish (long) positions to bearish (short) positions in the market. When the ratio is above one, there are more long positions than short ones. This suggests bullish sentiment, with most traders expecting the asset’s value to rise.
Converesly, as with HBAR, a ratio below one indicates that more traders are betting on a price decline than on a price increase. This suggests that many HBAR holders are unfazed by its recent gains and anticipate a bearish reversal soon.
HBAR Eyes $0.19 as Bulls and Bears Battle for Control
At press time, HBAR trades at $0.17, approaching resistance formed at $0.19. With waning buying pressure, the altcoin risks reversing its current uptrend and initiating a decline toward $0.15.
If sell-offs persist at this price level, the support floor could weaken, giving way to a further drop toward $0.12.
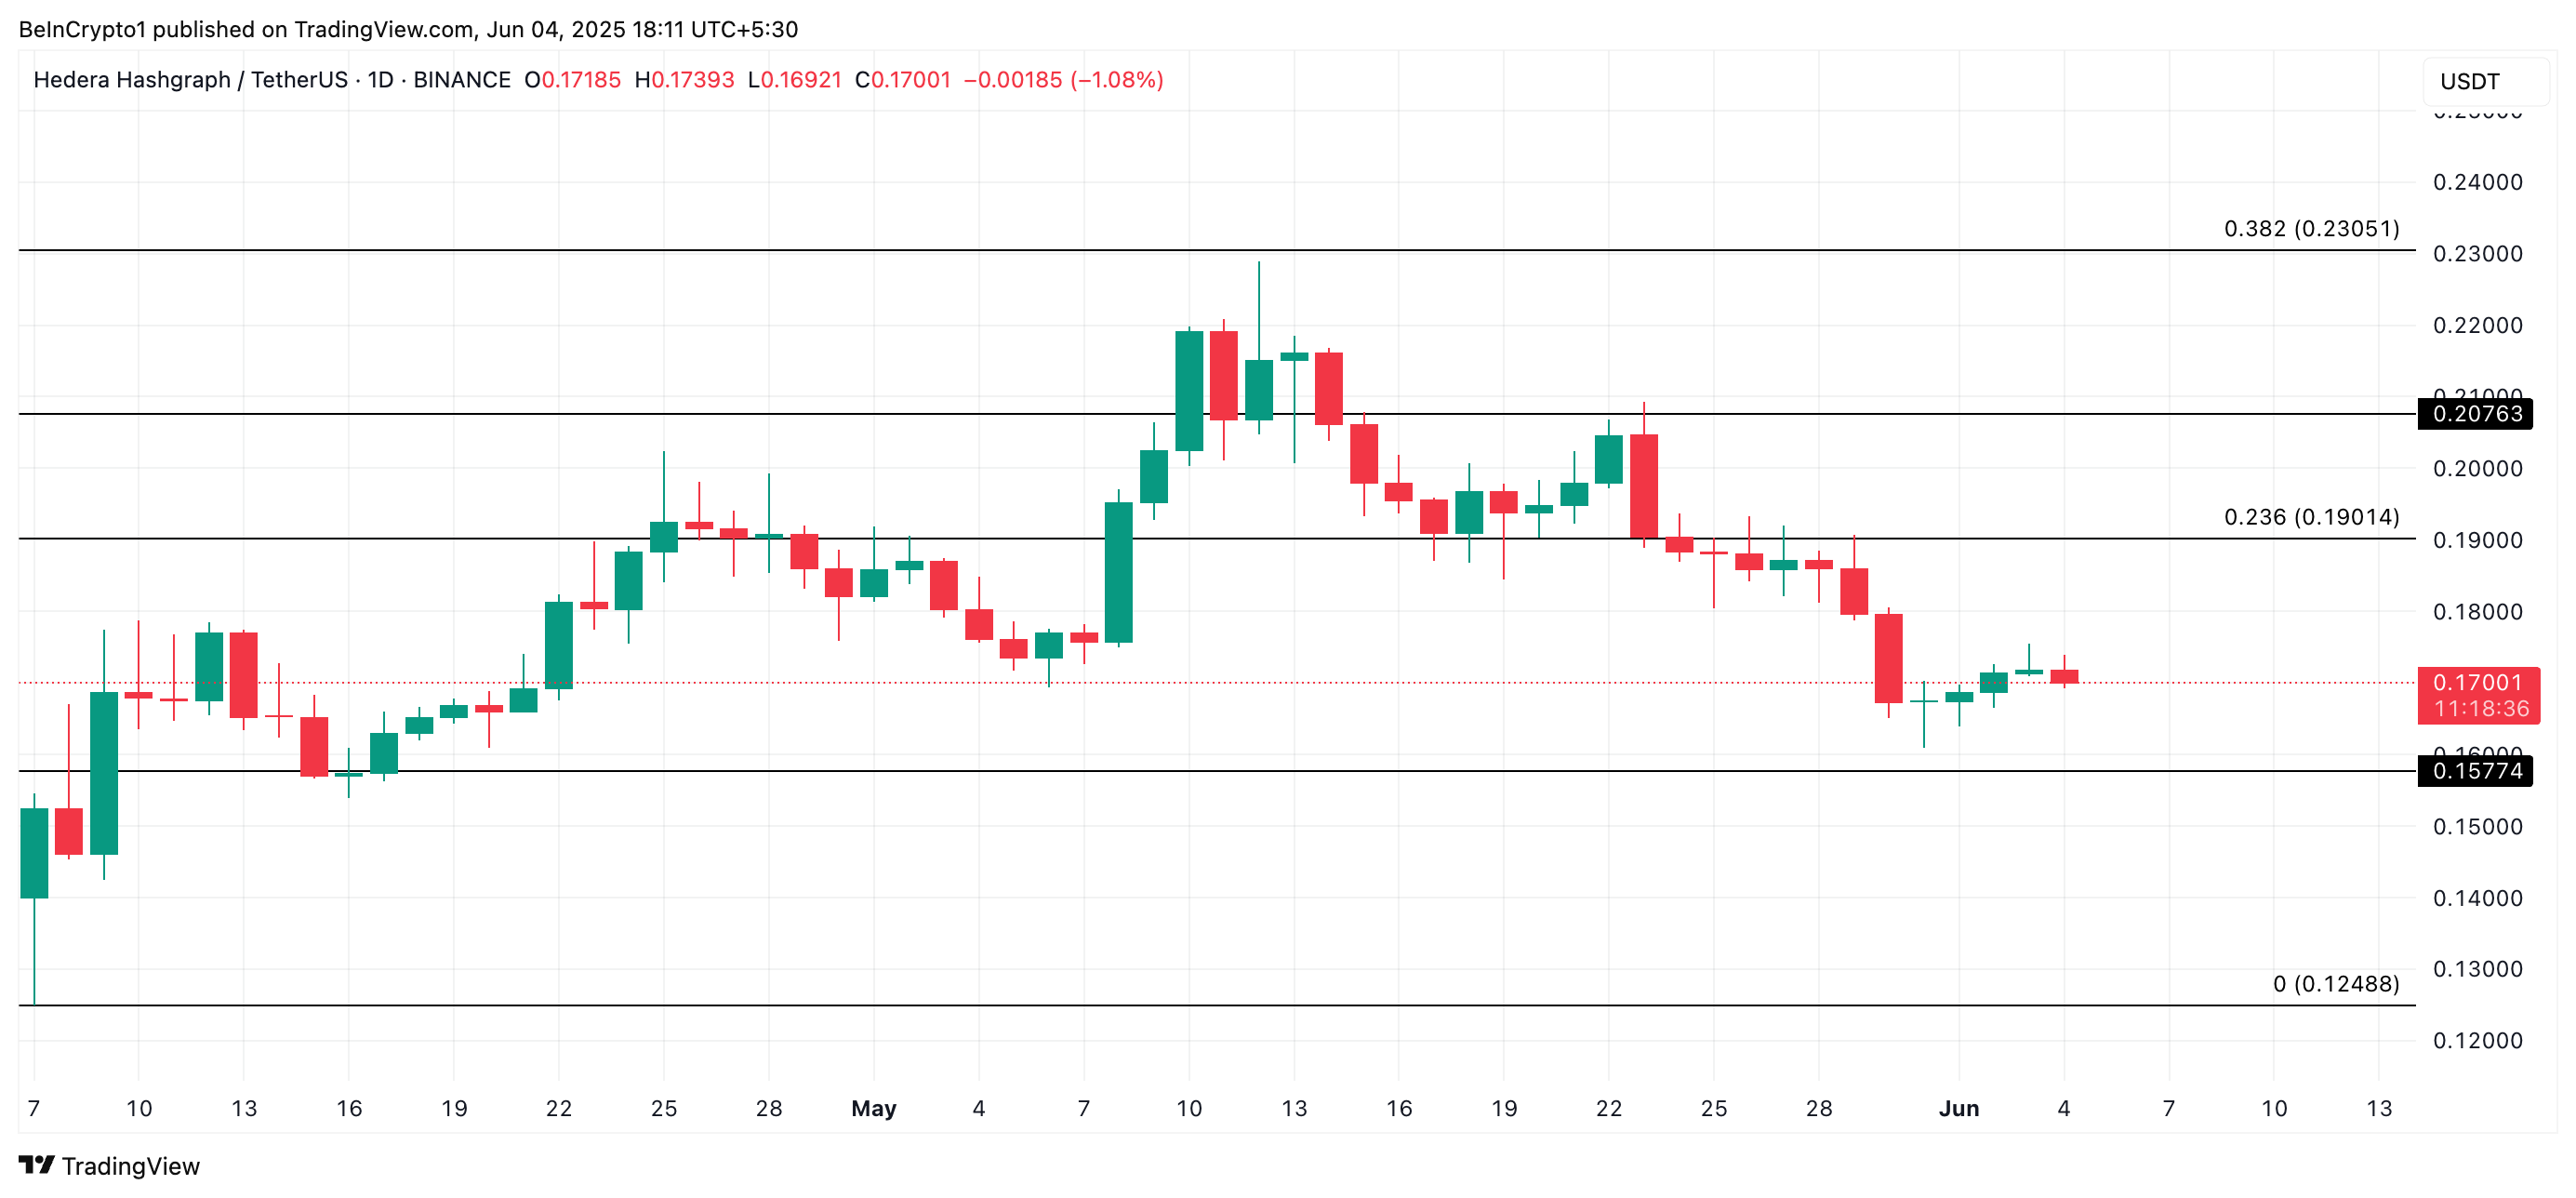 HBAR price Analysis. Source: TradingView
 However, if the bulls strengthen their control, they could drive the HBAR token price toward the $0.19 ceiling. A breach of this level could trigger a rally to $0.20.