Curve DAO Token is showing signs of renewed bearish pressure as it slips beneath key technical support zones heading into June 2025. While short-term rebounds remain possible, the broader structure hints at building downside momentum. Traders are watching closely to see whether the Curve DAO Token price today can stabilize, or if the latest drop will extend toward deeper retracement levels.
What’s Happening With Curve DAO Token’s Price?
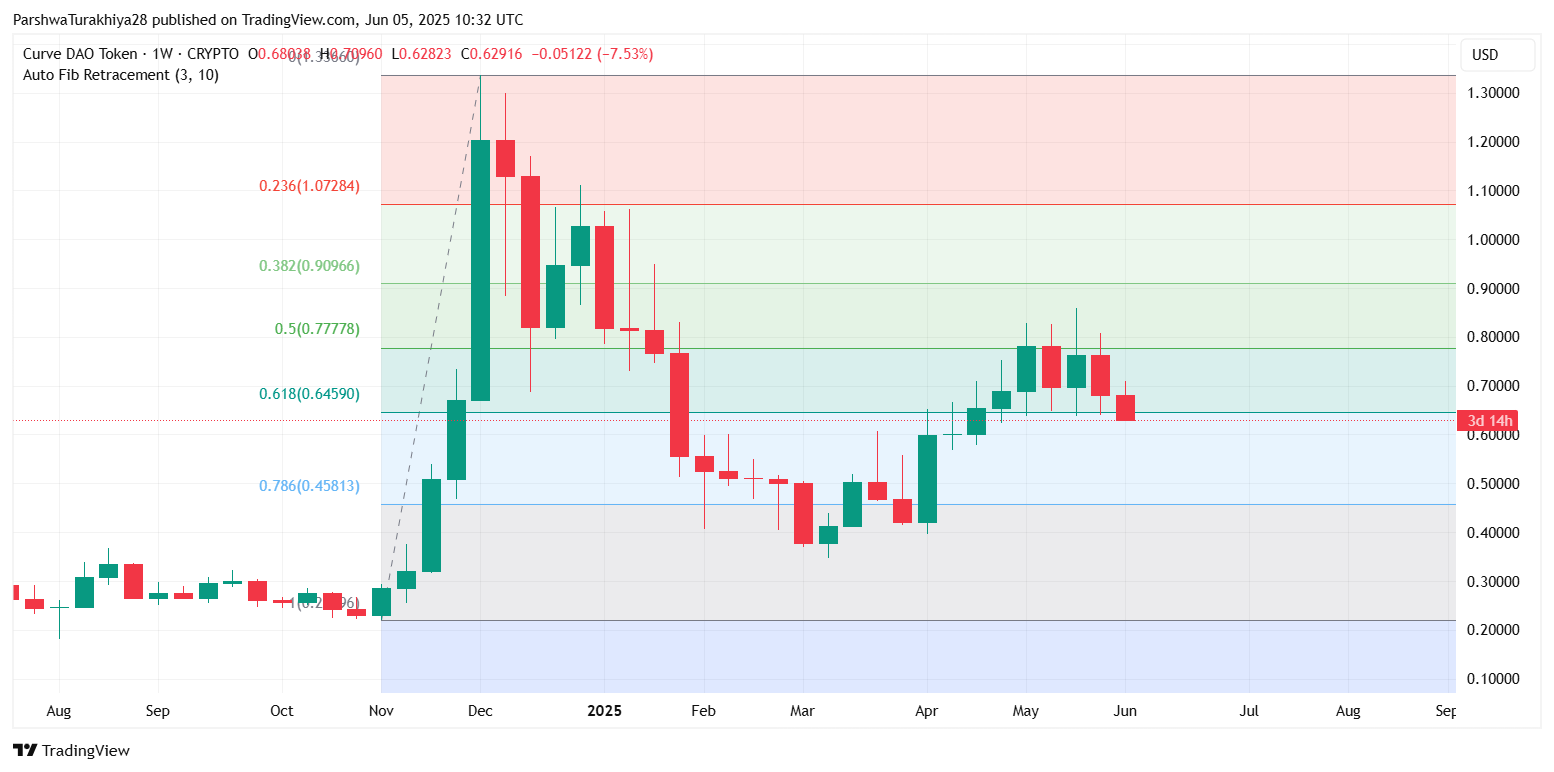 CRV price dynamics (Source: TradingView)
 At the time of writing, the Curve DAO Token price is trading around $0.6289, having shed nearly 7.5% in the last weekly candle. The asset has now broken below the 0.618 Fibonacci retracement level at $0.6459, which had been acting as medium-term support on the weekly chart. Price action over the last few sessions shows increasing selling volume and a struggle to reclaim the $0.66–$0.68 area.
 CRV price dynamics (Source: TradingView)
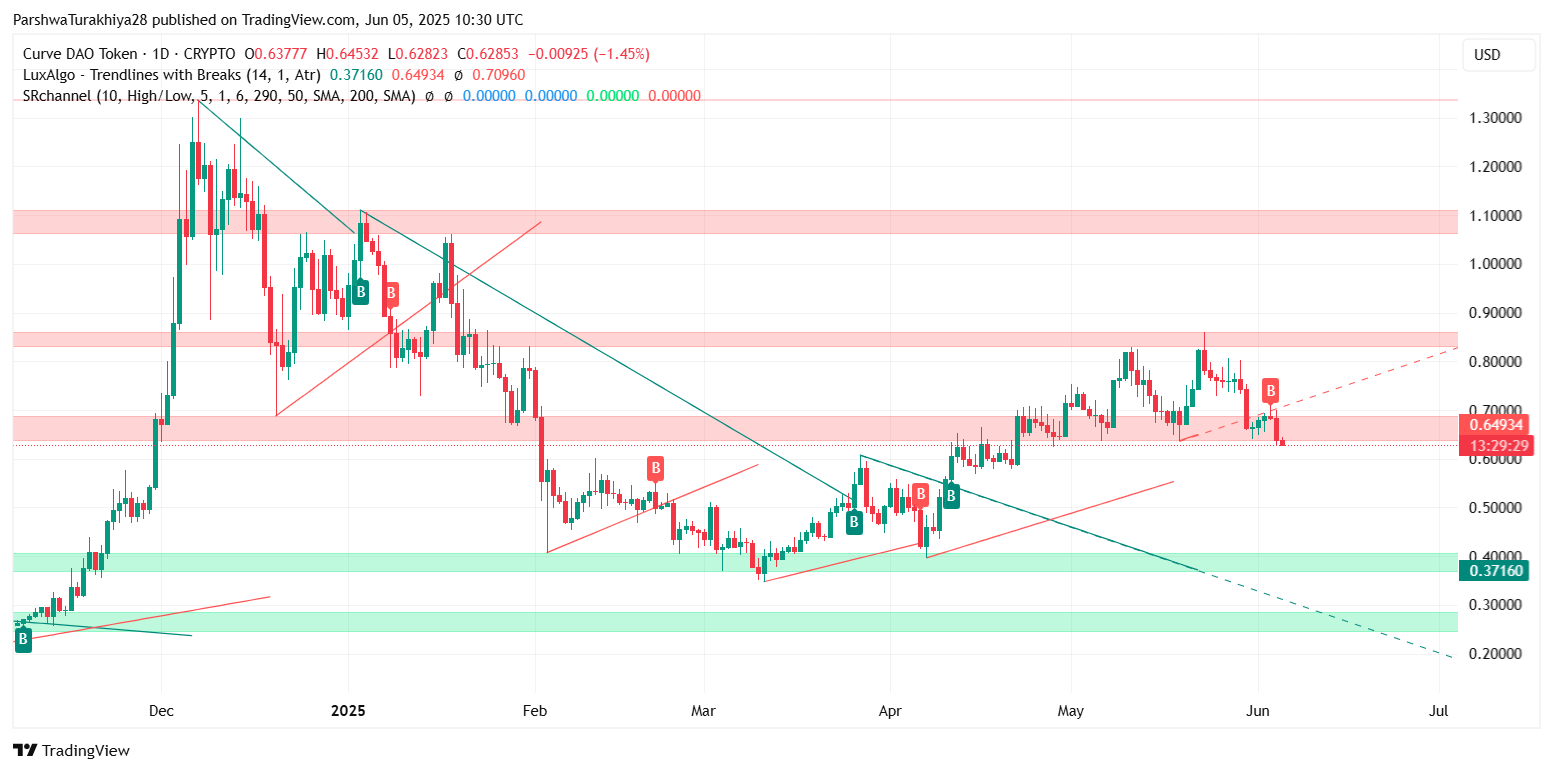
 The Curve DAO Token price update reveals a decisive breakdown from the rising channel structure formed since mid-April. Notably, the daily chart also reflects a close below both the 50-EMA and the horizontal demand band between $0.64 and $0.66. If this area fails to recover, momentum could accelerate downward toward $0.58 and even $0.51.
Curve DAO Token Price Action Faces Critical Test
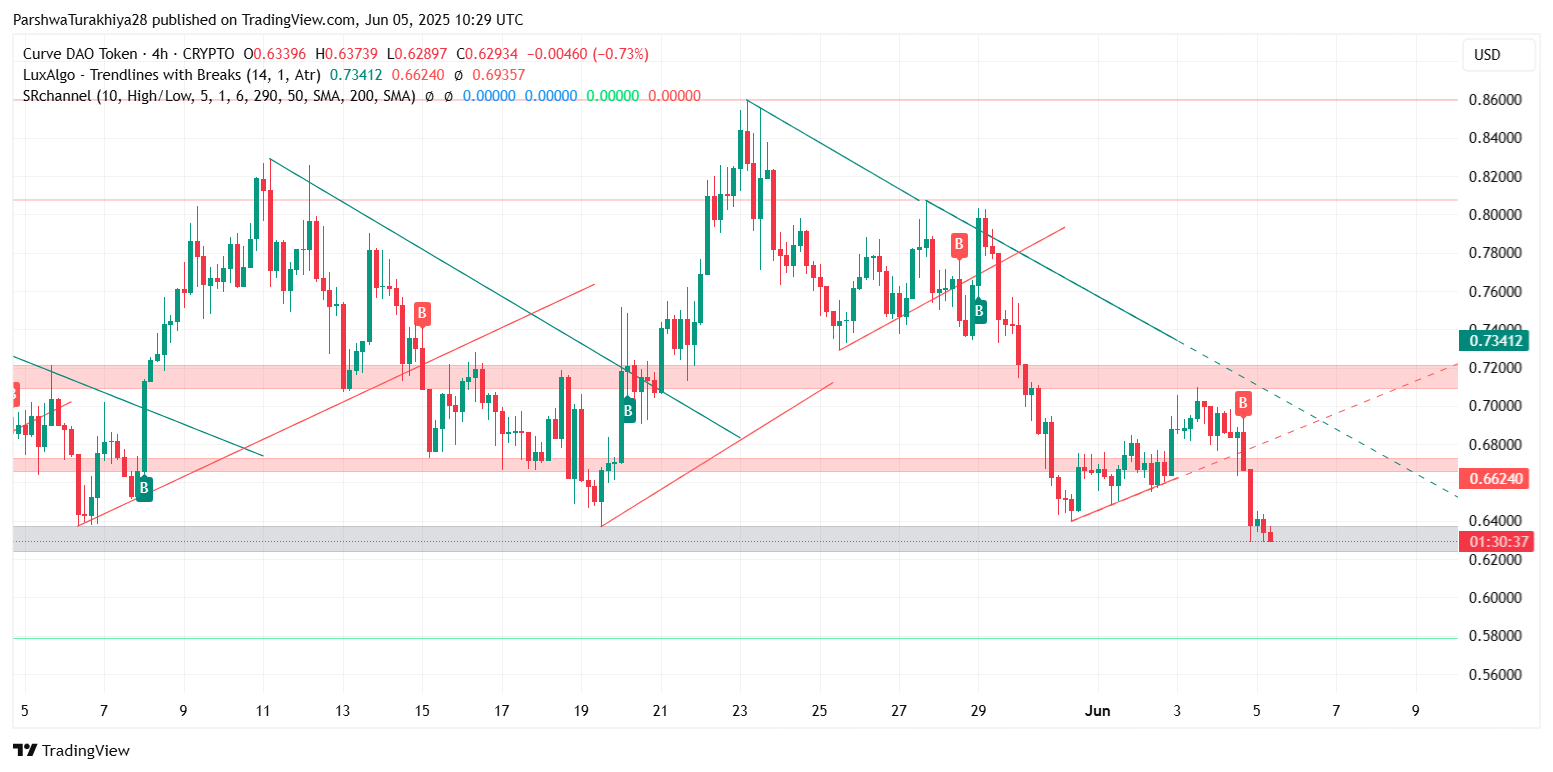
 CRV price dynamics (Source: TradingView)
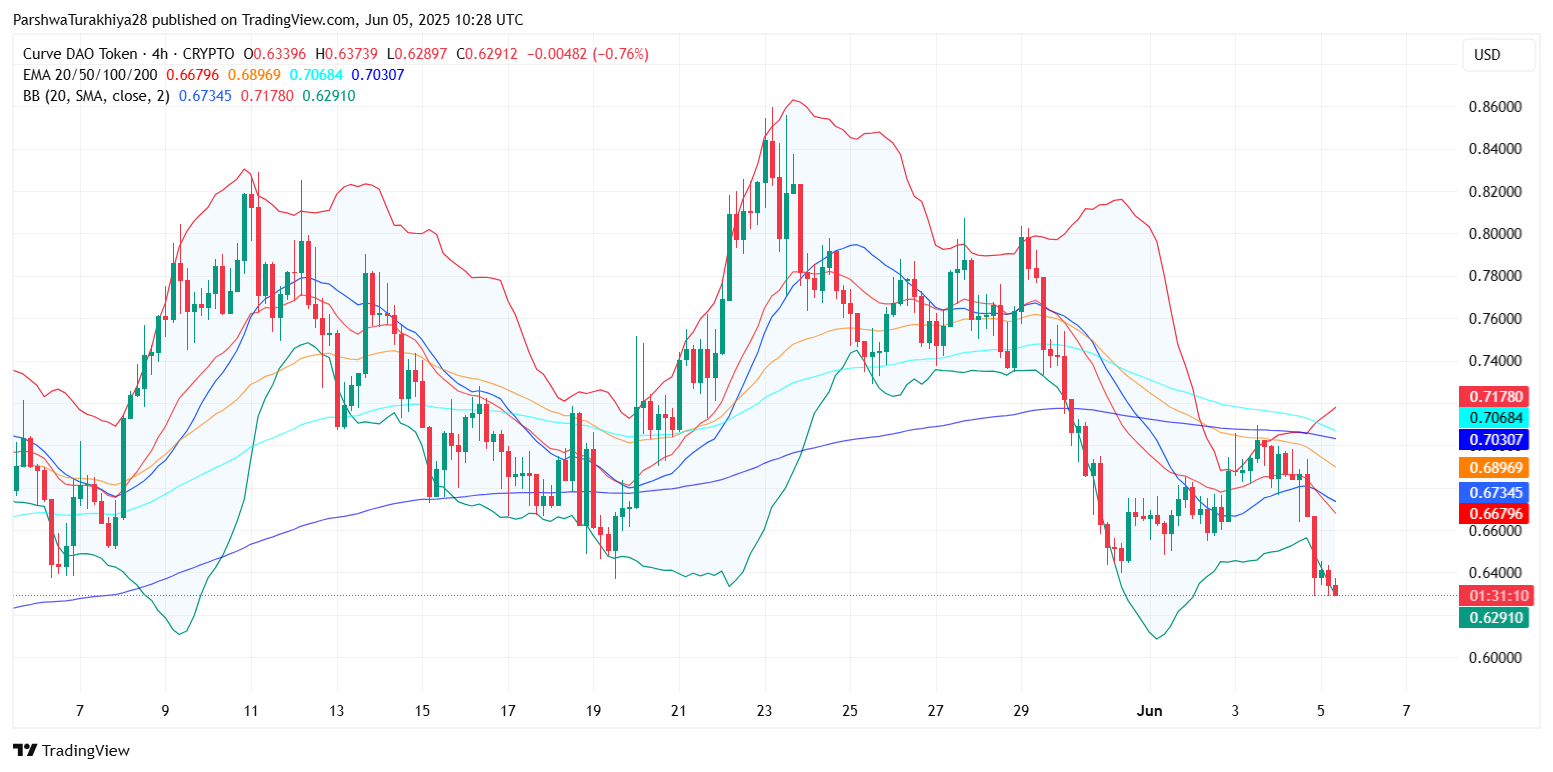
 The 4-hour chart confirms that Curve DAO Token price action is under immediate selling pressure. After multiple failed attempts to retest resistance around $0.70, CRV reversed sharply from trendline resistance and has now entered a lower support zone. Key EMAs (20/50/100) are all sloping downward, and price is now struggling below them—a clear bearish signal.
In terms of Curve DAO Token price volatility, Bollinger Bands have widened significantly, with the lower band expanding toward $0.61. This indicates increasing directional force, and given current positioning, the downside remains the path of least resistance unless price can reclaim the $0.66 handle swiftly.
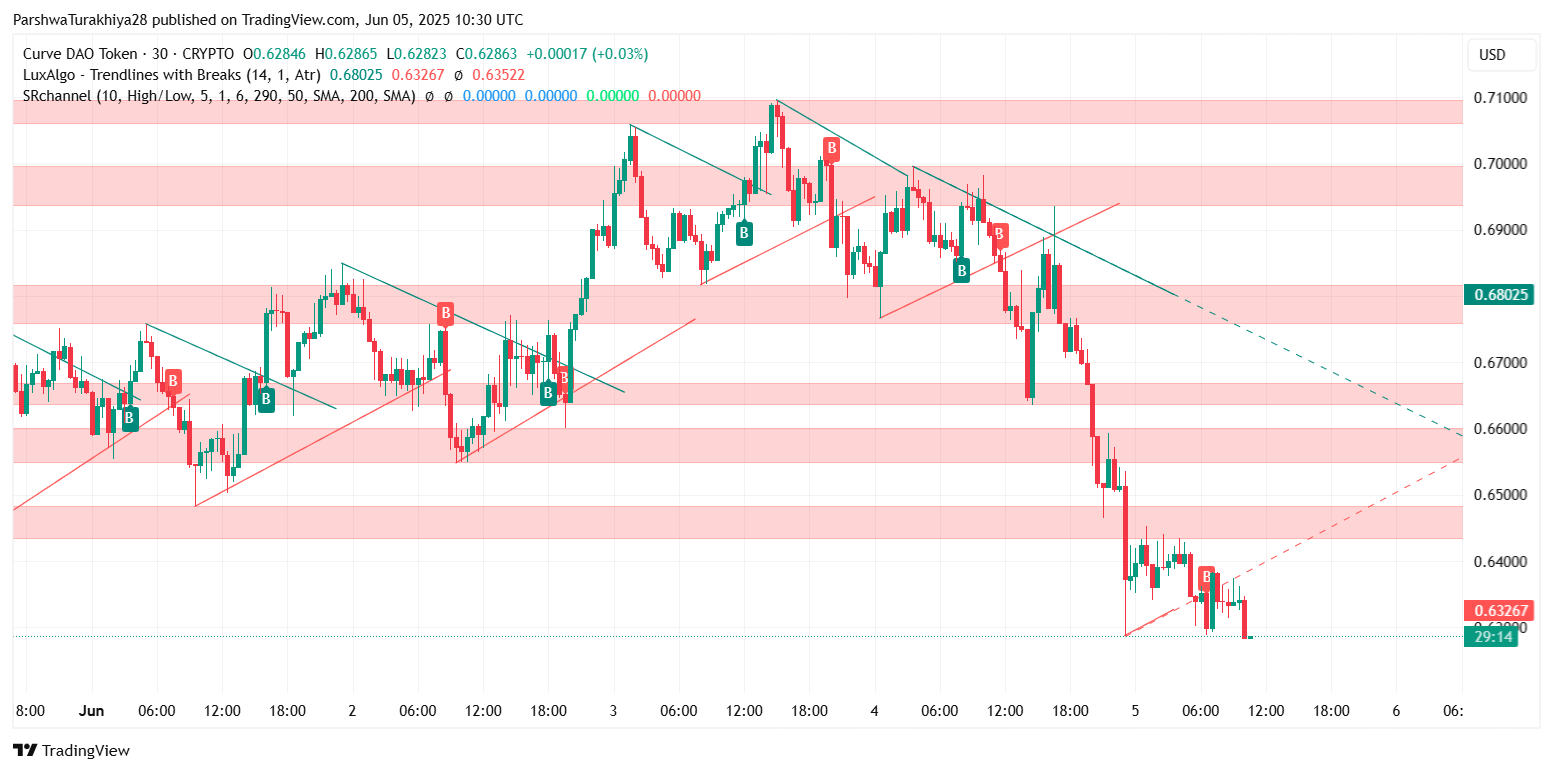
 CRV price dynamics (Source: TradingView)
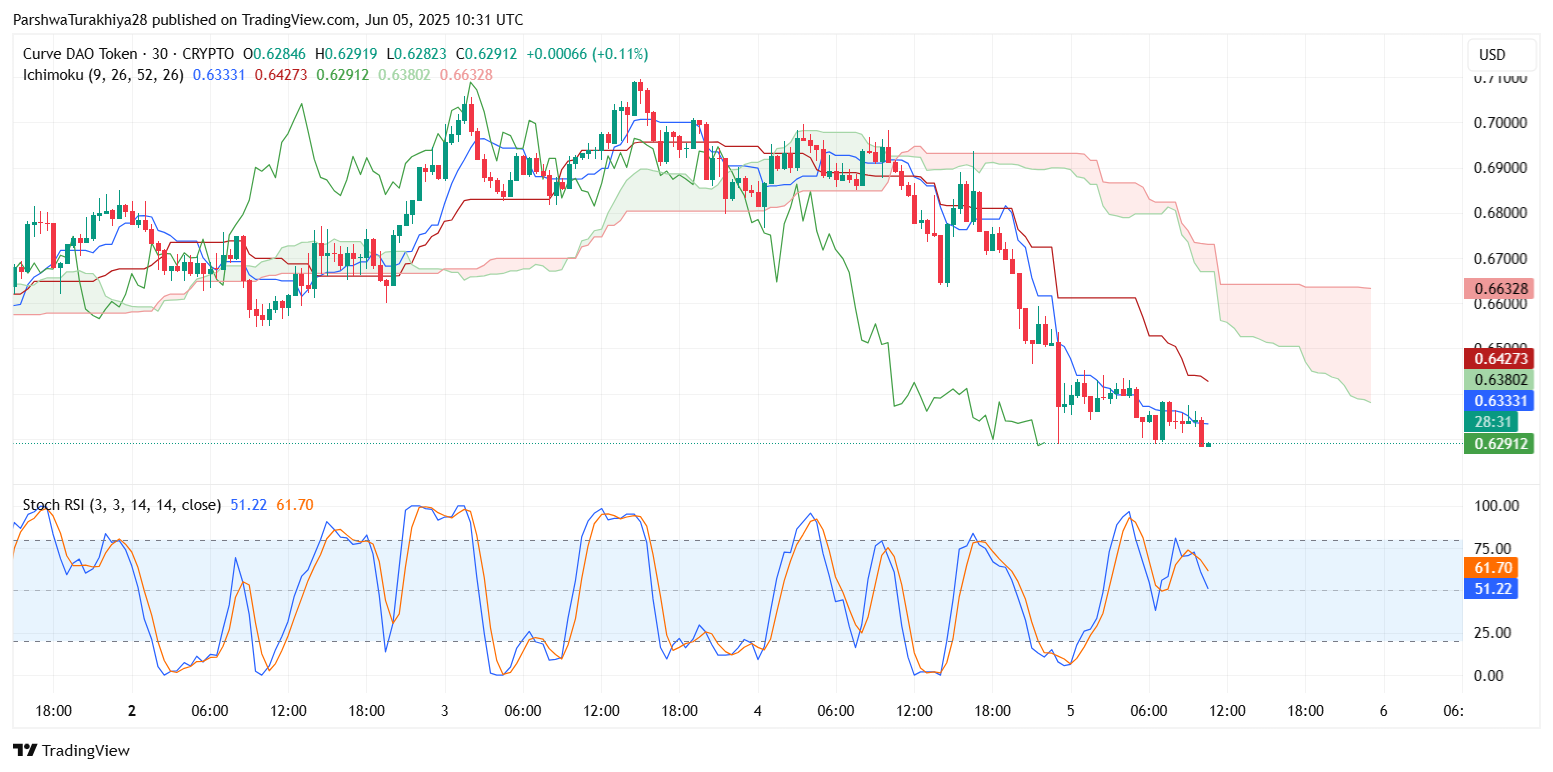
 Ichimoku Cloud analysis on the 30-minute timeframe further reflects weakness, with CRV trading below the cloud and both conversion and baseline lines angling down. The Curve DAO Token price today continues to hover near intraday lows, hinting that bulls are yet to show meaningful defense.
Momentum Indicators Signal More Weakness Ahead
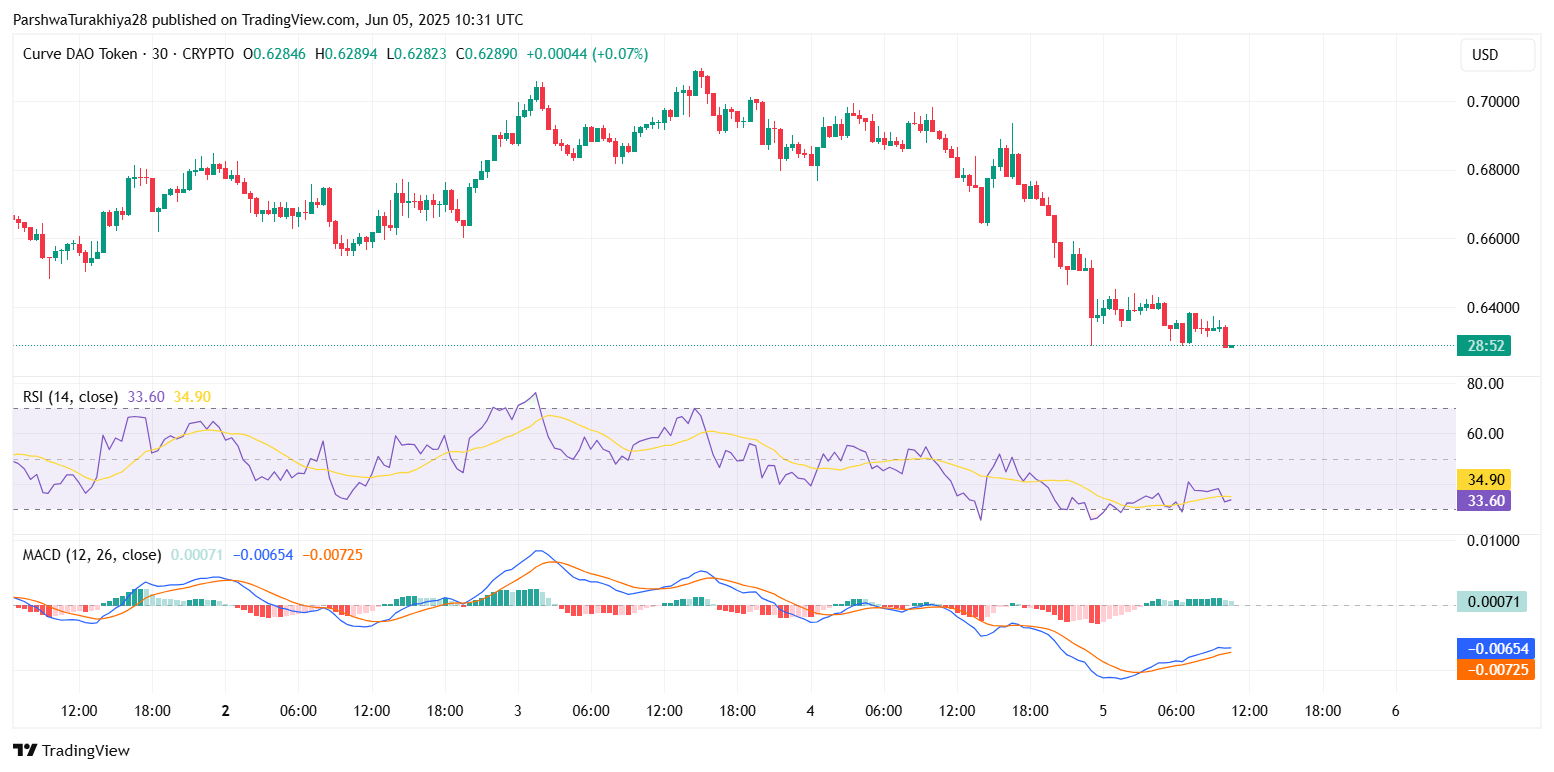 CRV price dynamics (Source: TradingView)
 The short-term RSI on the 30-minute and 4-hour charts is hovering below 35, suggesting oversold but not yet reversing territory. This aligns with the broader sell bias. MACD is also in bearish territory on multiple timeframes, though with slightly narrowing histogram bars, there could be brief relief bounce potential.
Stochastic RSI remains in the lower quadrant, pointing to continued downside pressure unless a sharp cross occurs. Taken together, this constellation of indicators suggests that while CRV may find brief support near $0.62, the prevailing trend is still tilted downward.
Why Curve DAO Token Price Going Down Today
 CRV price dynamics (Source: TradingView)
 The primary reason why Curve DAO Token price going down today lies in the repeated rejection from the $0.70 zone and failure to hold above EMA clusters. Technically, this suggests exhaustion from the prior uptrend and a shift toward a corrective phase. The breakdown below the key Fibonacci zone adds to the bearish narrative.
Additionally, wider market sentiment has turned defensive amid Bitcoin and Ethereum range-bound consolidation, reducing capital flow to altcoins like CRV. The result is heightened fragility in price levels that previously acted as demand zones.
Curve DAO Token Price Forecast for June 2025
 CRV price dynamics (Source: TradingView)
 Looking ahead, CRV must hold the $0.61–$0.62 support band to prevent a deeper correction. If this zone breaks decisively, the next strong support lies at $0.58, followed by $0.51 near the 0.786 Fib level. To regain bullish momentum, CRV would need to reclaim $0.66 and ultimately flip $0.70 into support—a tall order given current structure.
 CRV price dynamics (Source: TradingView)
 Traders may want to watch the next weekly candle close closely. A close below $0.63 could confirm continuation toward the lower Fib levels, while a strong reclaim of $0.66 would begin to invalidate the current bearish trajectory.
CRV Technical Forecast Summary
| Indicator/Zone | Level |
| Current Price | $0.6289 |
| Major Support | $0.62, $0.58 |
| Major Resistance | $0.66, $0.70 |
| RSI (30-min/4H) | 33–35 (bearish) |
| MACD (4H) | Bearish crossover |
| Ichimoku Cloud | Below cloud (bearish) |
| EMA Cluster Resistance | $0.66–$0.70 |
| Key Fib Levels | 0.618 at $0.6459, 0.786 at $0.4581 |
Disclaimer: The information presented in this article is for informational and educational purposes only. The article does not constitute financial advice or advice of any kind. Coin Edition is not responsible for any losses incurred as a result of the utilization of content, products, or services mentioned. Readers are advised to exercise caution before taking any action related to the company.