HBAR Price Shrugs Off ETF Hype, Yet Flashes Hidden Bullishness Amid Dip Buying
HBAR has fallen nearly 9% over the past week, and even in the last 24 hours, the price is down another 4%, despite swirling rumors that BlackRock may soon file for an HBAR ETF. If true, it would be the third major fund tied to HBAR, after those listed by Canary and Grayscale.
But so far, the market hasn’t reacted with any of the typical ETF-driven euphoria. Instead of surging, HBAR continues to correct, but under the surface, something bullish is brewing, and it starts with whale wallets.
Whales Buy the Dip as Price Quietly Drops
Between August 11 and August 18, wallets holding 10 million or more HBAR increased from 102.28 to 106.85; a rise of 4.57 wallets, which translates to at least 45.7 million HBAR in net accumulation.
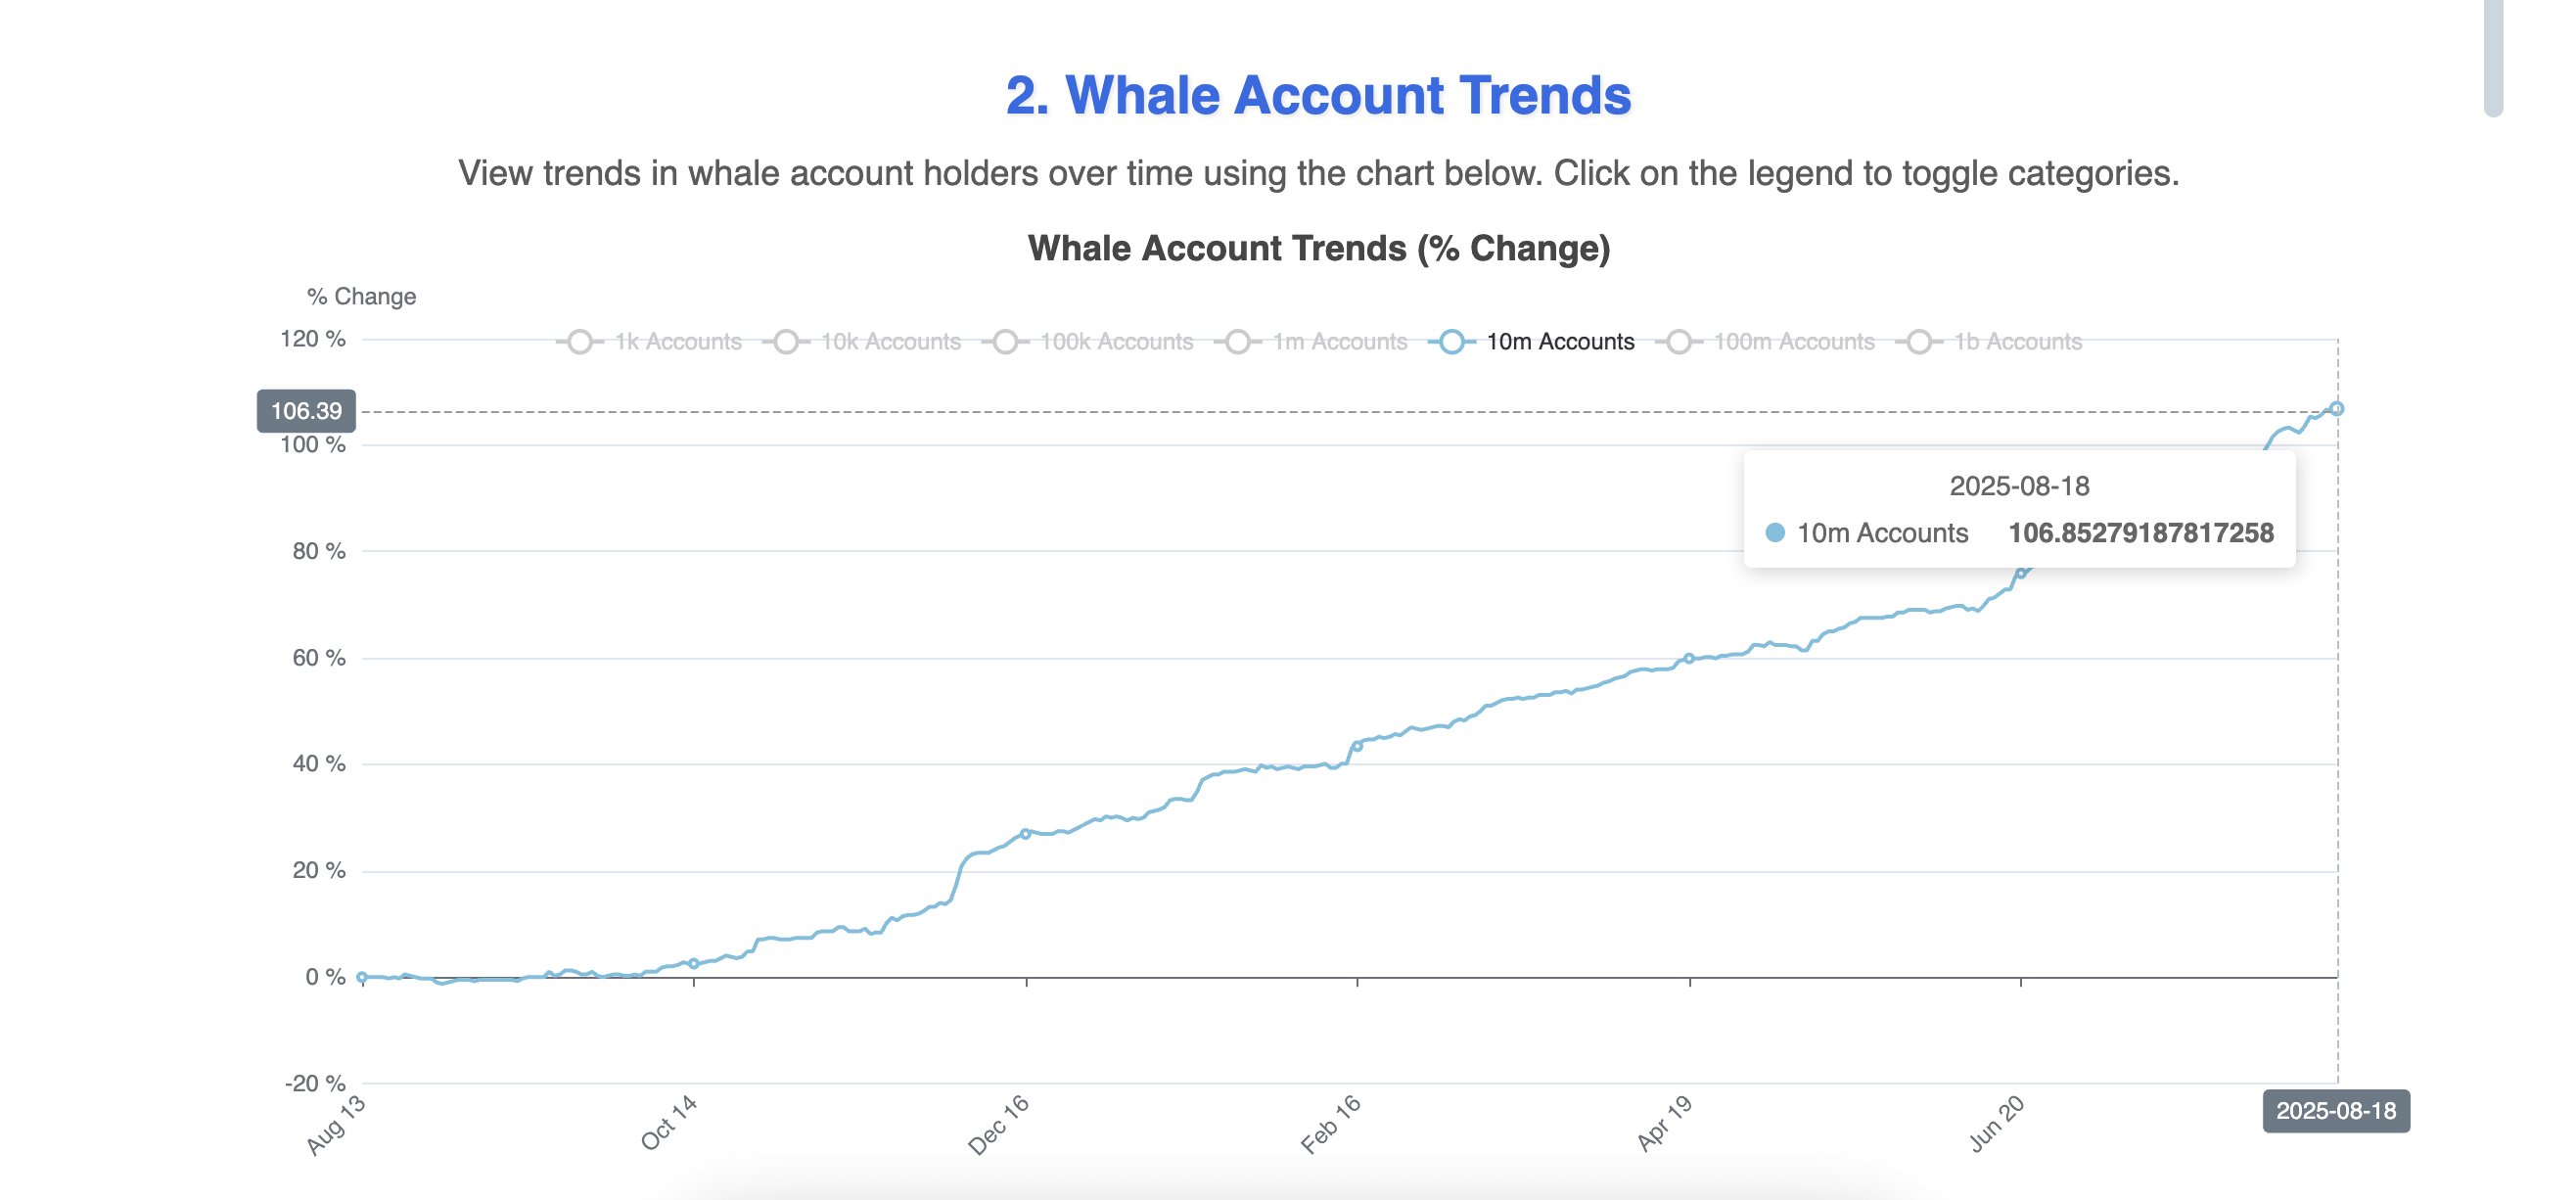 HBAR whales keep accumulating:
 The buying took place while the HBAR price dropped from $0.26 to $0.24, a fall of around 8%. In other words, while most of the market was panicking or staying on the sidelines, this heavyweight cohort loaded up on tokens.
The move suggests high-conviction buying during weakness, possibly in anticipation of the ETF rumors materializing or a technical setup forming.
For token TA and market updates: Want more token insights like this? Sign up for Editor Harsh Notariya’s Daily Crypto Newsletter.
Two Bullish HBAR Price Patterns Are Now in Play
It is worth noting that the daily HBAR price chart (on a shorter time frame) shows a stalemate-like scenario between the bulls and bears, leading to the range-bound movement. The cohort that comes out on top would determine the next leg of the price action.
The Bull Bear Power (BBP) indicator measures the difference between the high and low prices relative to a moving average, indicating whether bulls or bears are currently stronger. In this case, the indicator reflects a stalemate, with neither side clearly dominating.
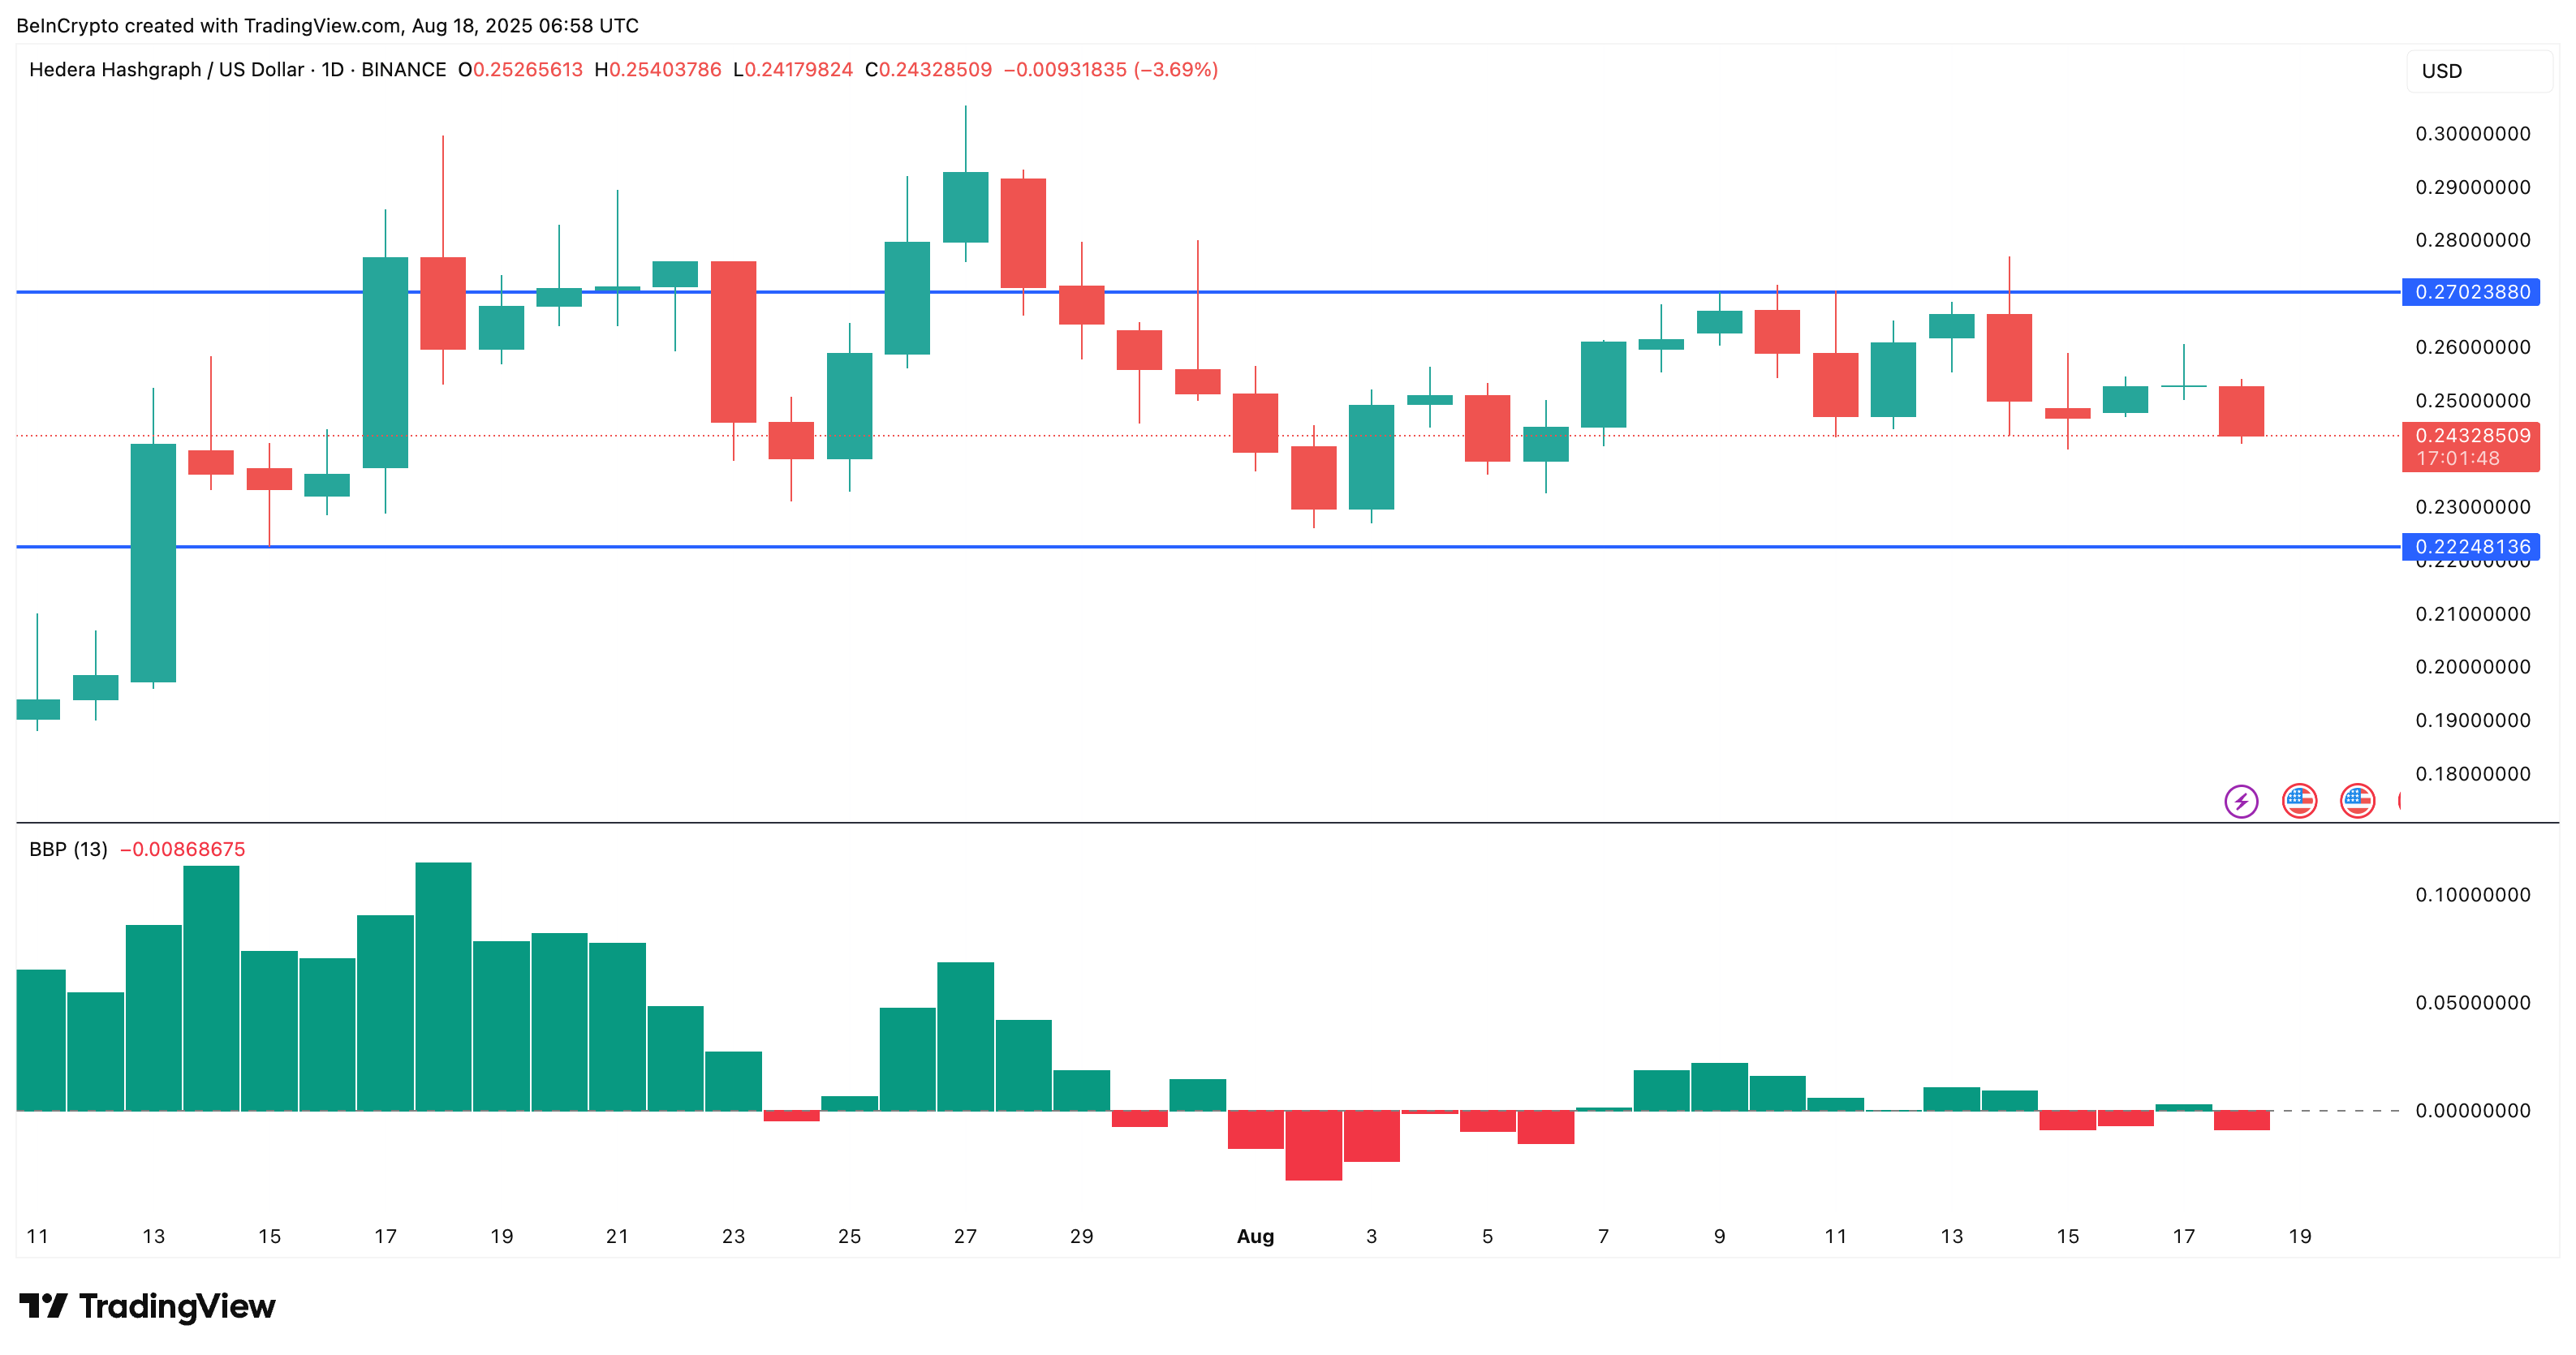 HBAR price and the bull-bear stalemate:
 It is this level of indecisiveness that made it necessary to move to the 3-day chart, where two clear bullish signals emerge.
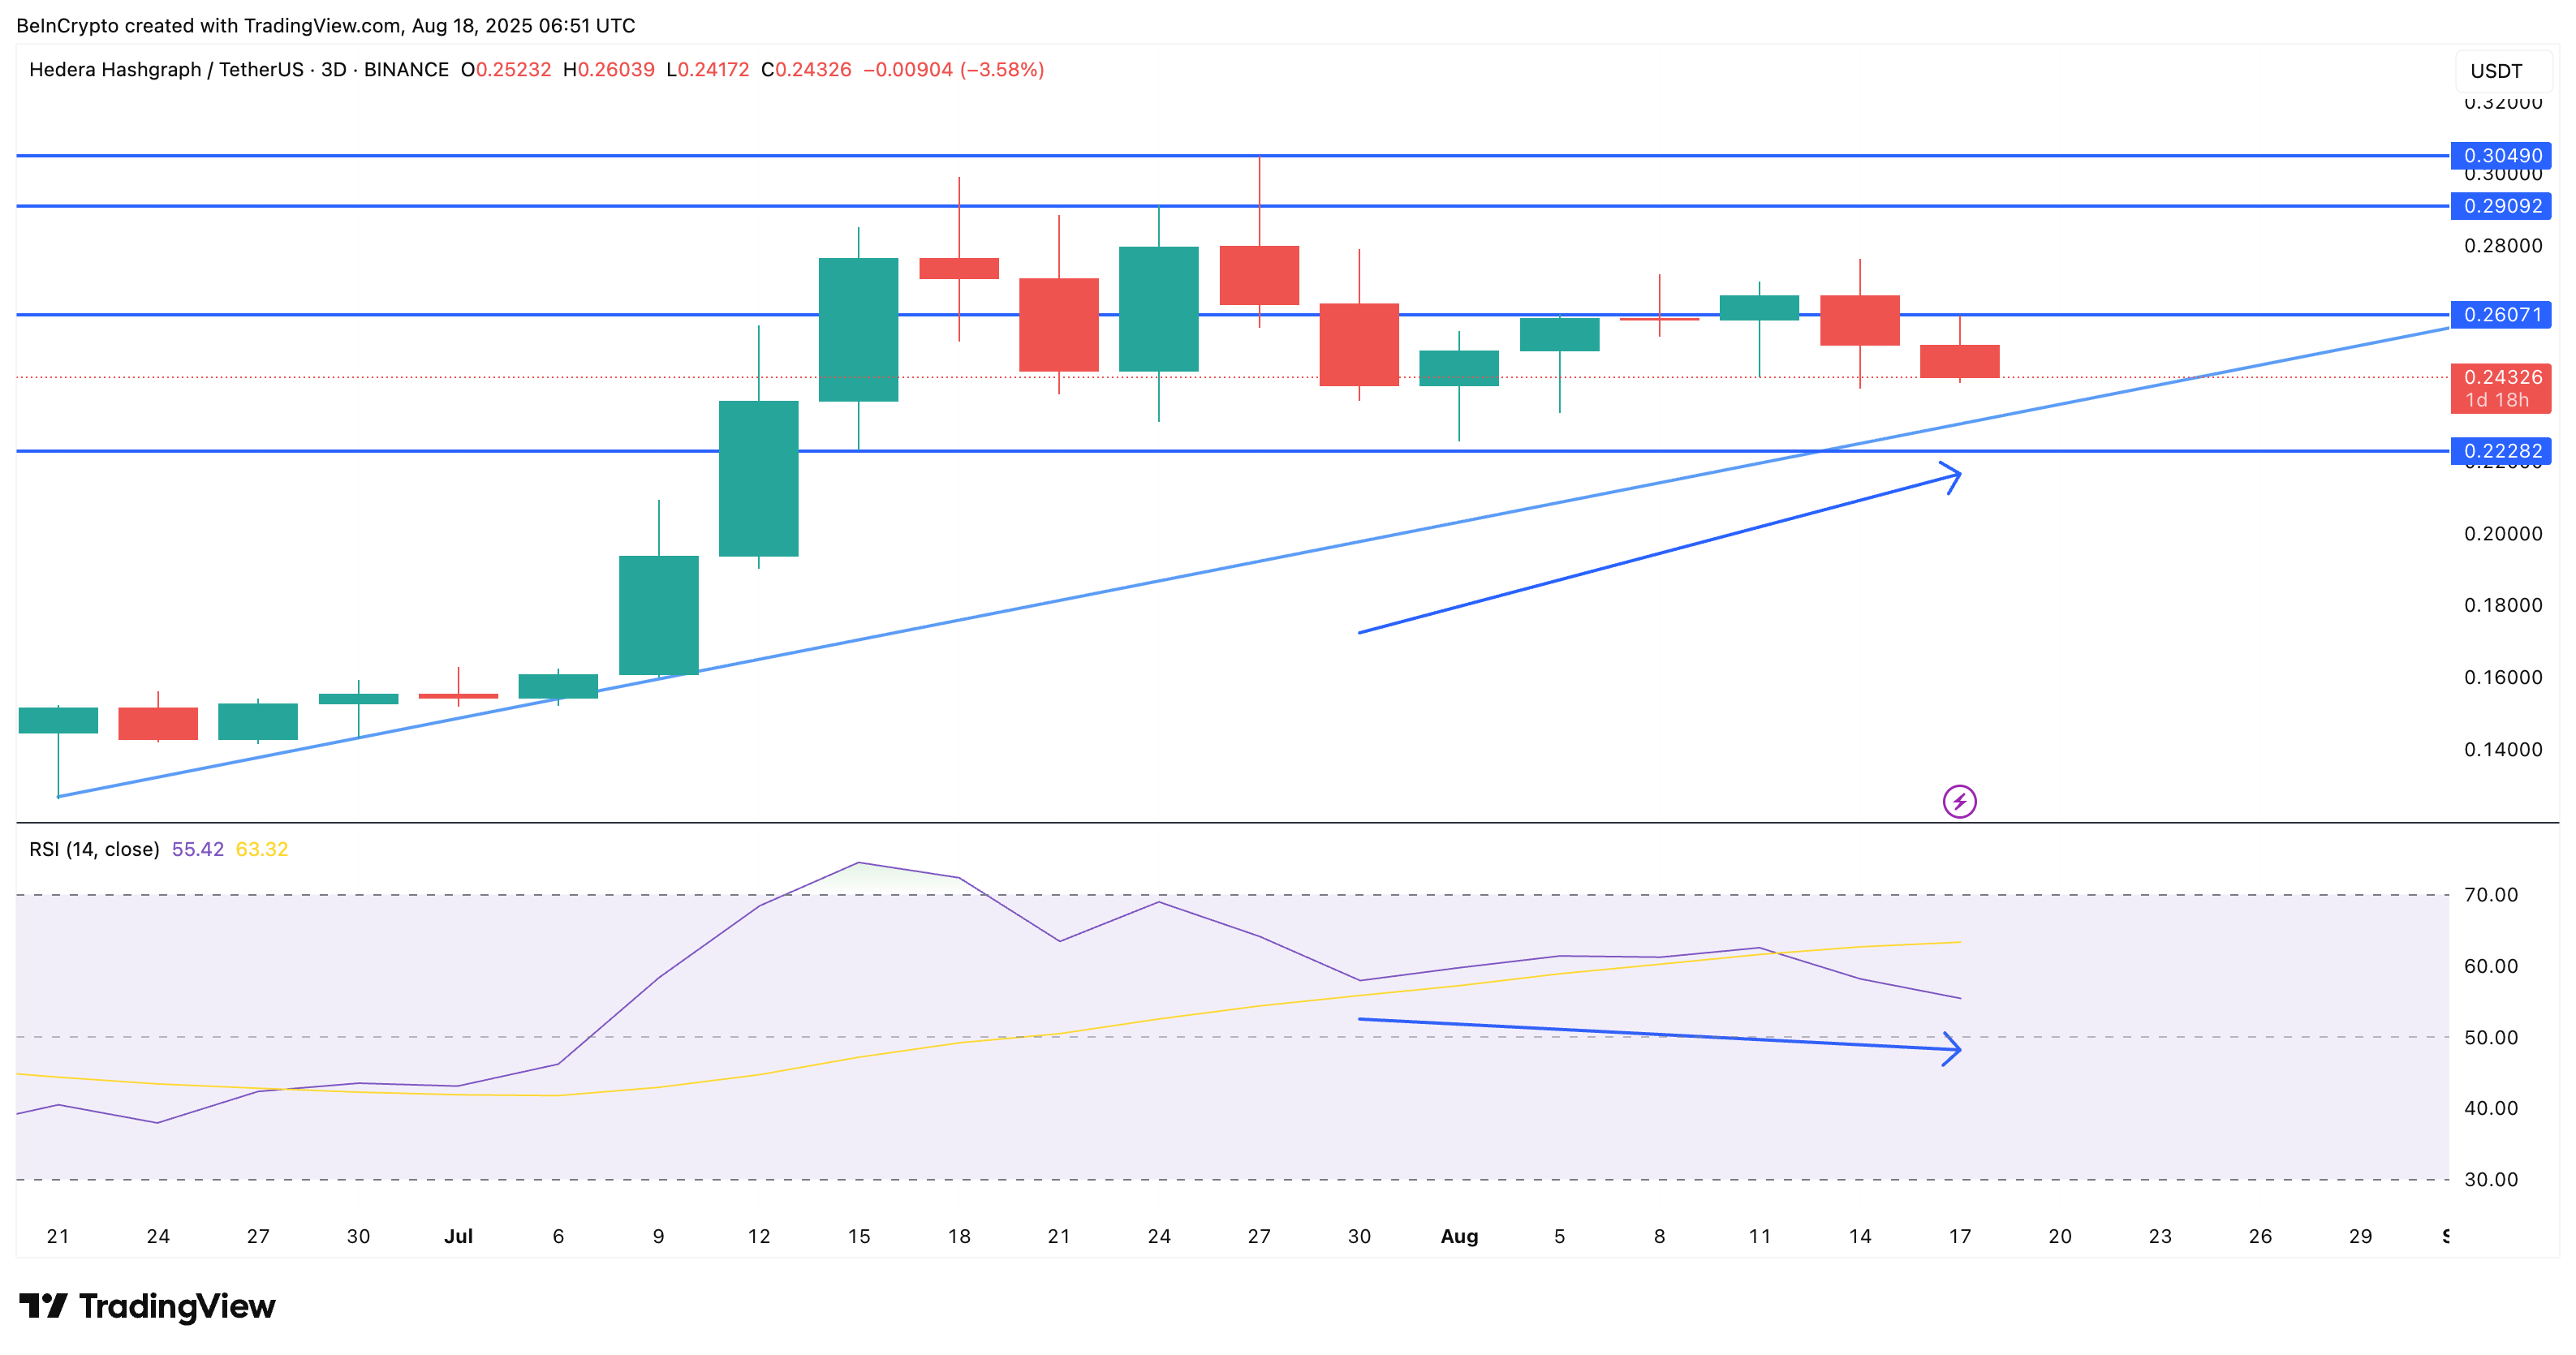 HBAR price analysis:
 First, the ascending triangle is holding firm, with rising lows forming against a consistent resistance trendline. The key resistance levels are at $0.26 and $0.29, which form the upper trendlines of the triangle pattern.
Breakout confirmation would be a decisive close above $0.30, which could flip HBAR’s mid-term structure bullish.
Second, a hidden bullish RSI divergence has been forming. Between July 30 and August 17, the HBAR price has been making higher lows, while the 3-day RSI printed lower lows. This is a classic case of momentum resetting while price maintains trend structure, often signaling that sellers are losing grip.
If whale buying momentum continues and the RSI divergence plays out, it could fuel a breakout beyond the $0.30 zone. The confirmation of the BlackRock ETF rumor might add more fuel to this bullish chart pattern. Yet, a dip under $0.22 would invalidate the bullishness and might push the HBAR price towards new lows.