Bitcoin bull market indicators show a clear cooling: eight of ten CryptoQuant Bull Score Index metrics are bearish, signaling reduced momentum even as BTC briefly reclaimed $116,000. Traders should monitor demand growth and technical signals, the only bullish inputs, for signs of renewed strength.
-
8 of 10 bull indicators are bearish
-
Bitcoin briefly reclaimed $116,000; correction remains shallower than previous cycles
-
CoinGlass CBBI registers 74—about three-quarters into the bull market; only altseason peak flag is active
Bitcoin bull market indicators show cooling momentum; read the latest analysis and next steps. COINOTAG reports—stay informed and act wisely.
What are Bitcoin bull market indicators?
Bitcoin bull market indicators are composite on-chain and market metrics designed to measure bull-cycle strength and momentum. They aggregate signals such as demand growth, MVRV-Z score, stablecoin liquidity, exchange flows and realized profit metrics to indicate whether the market environment is bullish or bearish.
How have the indicators changed recently?
Recently, the majority of these metrics shifted to bearish. According to CryptoQuant data, eight of ten Bull Score sub-indicators are red, prompting analysts to conclude that Bitcoin momentum is clearly cooling. Only “Bitcoin demand growth” and “Technical signal” remain bullish.
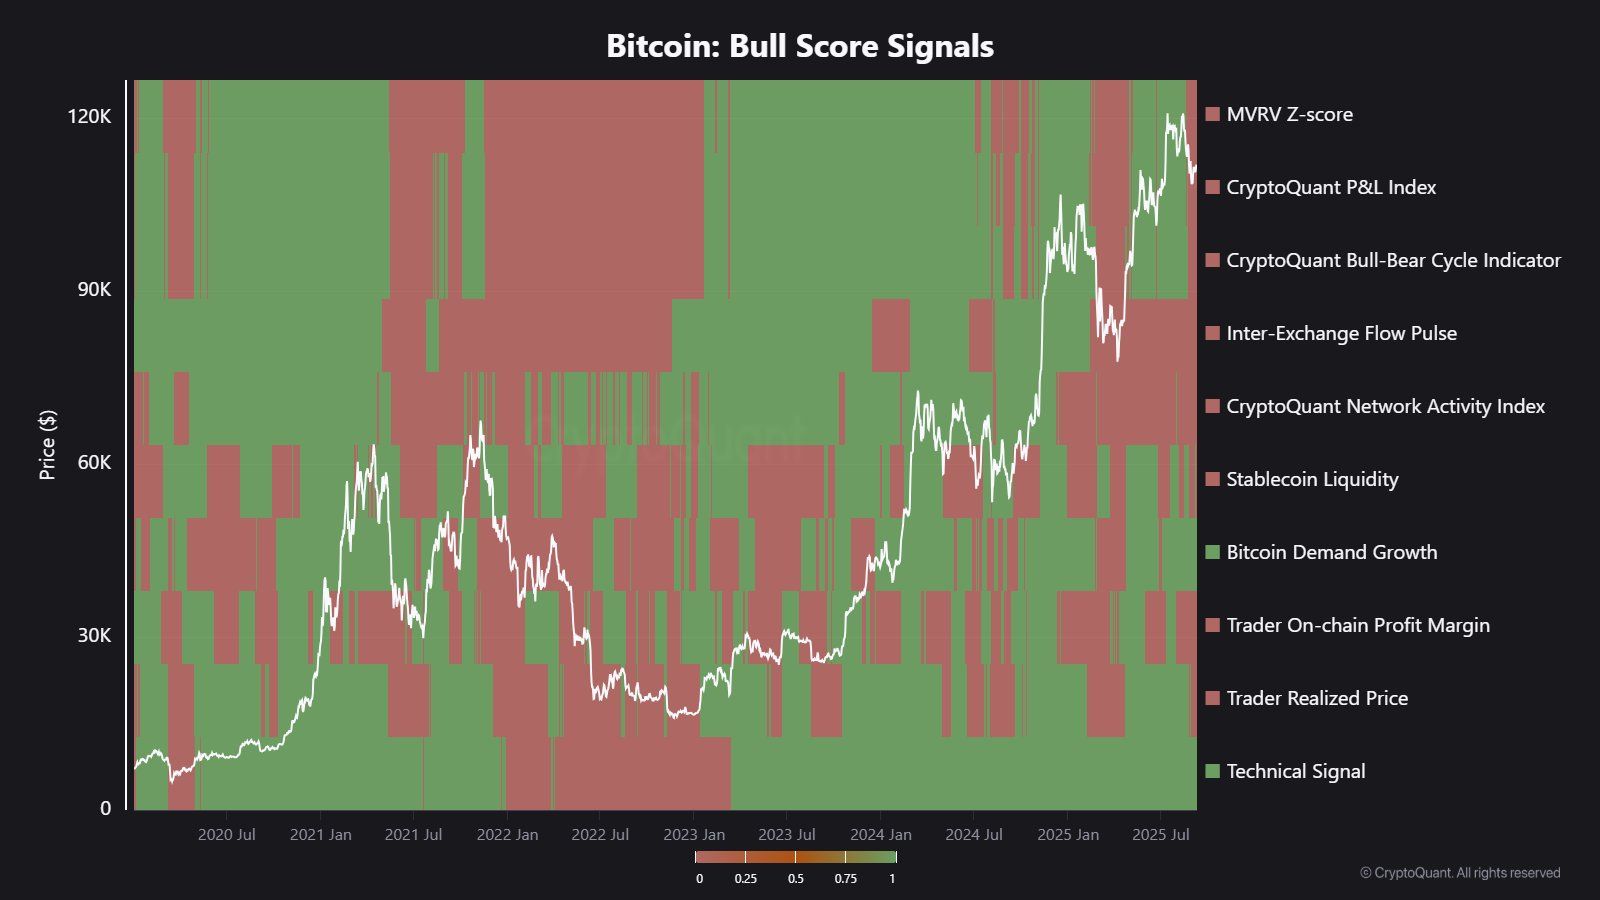 Bull Score Index indicators are bearish. Source: CryptoQuant (plain text)
 Why do eight indicators matter?
Eight bearish readings indicate broad-based weakness across supply, demand and liquidity metrics. Key red metrics include MVRV-Z, profit and loss index, exchange flow pulse and trader realized price—each highlighting reduced on-chain support compared with prior peaks.
When did similar readings appear previously?
The last time eight of ten bull indicators flipped bearish was in April, coinciding with BTC’s drop toward $75,000. By contrast, an eight-of-ten green reading in July matched BTC’s spike to about $122,800 earlier in the year. These historical parallels show how the composite score historically aligns with major price phases.
| Bitcoin demand growth | Bullish | Rising buying interest since July |
| Technical signal | Bullish | Price-based momentum indicators |
| MVRV-Z score | Bearish | Price vs realized value weak |
| Exchange flow pulse | Bearish | Net movement to exchanges increasing sell pressure |
How is Bitcoin price reacting?
Bitcoin briefly reclaimed $116,000 in early trading on Friday after a 1.5% daily gain, leaving it roughly 6.8% below its all-time high. Despite the bounce, on-chain momentum metrics remain muted, suggesting the move lacks broad supporting liquidity.
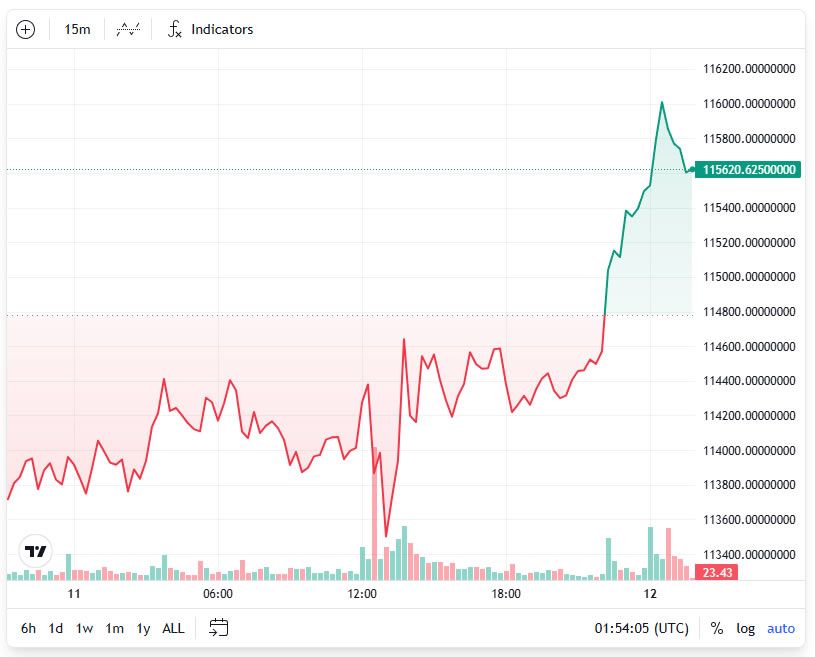 BTC reclaimed $116K briefly. Source: TradingView (plain text)
 What do market participants say?
Market practitioners note divergence between BTC and other risk assets. Analysts at trading firms highlight that BTC is lagging altcoins, equities and spot gold, while some voices expect an extended bull cycle with a potential local top in Q4 and a larger blow-off top in early 2026.
Frequently Asked Questions
Are the CryptoQuant readings definitive?
They are an informed composite of on-chain signals, useful for context but not a guarantee. Combine these scores with price action, liquidity measures and macro data before acting.
Is this a sign to liquidate positions?
No. For most traders the signal suggests caution: tighten risk controls, reduce size where appropriate, and wait for clearer multi-indicator confirmations before adding exposure.
Key Takeaways
- Majority bearish: Eight of ten Bull Score indicators are currently bearish, signaling cooling momentum.
- Price vs. momentum: BTC briefly hit $116,000, but on-chain momentum and liquidity metrics remain weak.
- Risk management: Favor defensive sizing and wait for multiple indicators to flip bullish before increasing positions.
Conclusion
COINOTAG analysis shows that Bitcoin bull market indicators have turned predominantly bearish, highlighting a cooling in on-chain momentum even as price attempts a recovery near $116,000. Traders should prioritize risk management, monitor demand growth and technical confirmations, and reassess positions if multiple indicators move back into bullish territory.
Publication date: 2025-09-12 | Updated: 2025-09-12 | Author: COINOTAG