XRP vs Bitcoin is currently range-bound, with Bollinger Bands tightening across daily, weekly and monthly timeframes, signaling consolidation rather than an imminent breakout. Traders should expect limited upside until a clear catalyst expands volatility and pushes XRP/BTC beyond the 0.00002900 BTC resistance or below 0.00002405 BTC support.
-
Daily and weekly Bollinger Bands are converging, indicating low volatility and consolidation in XRP/BTC.
-
Key resistance sits near 0.00002900 BTC while intraday support is around 0.00002550–0.00002405 BTC.
-
Monthly and four-hour frames confirm repeated rejections; historical rallies (2017 peak) show diminishing upward momentum.
XRP vs Bitcoin consolidation persists with narrowing Bollinger Bands; monitor 0.00002900 BTC resistance and 0.00002405 BTC support for breakout cues. Read latest analysis.
What is XRP’s outlook against Bitcoin?
XRP vs Bitcoin is trading in a consolidation phase, with narrow Bollinger Bands across major timeframes pointing to limited breakout potential. Price action centers near 0.00002620 BTC, and momentum indicators suggest traders should wait for volatility expansion or a catalyst before positioning for a directional move.
How do Bollinger Bands indicate consolidation for XRP/BTC?
Bollinger Bands narrow when volatility declines; on the daily chart XRP sits at 0.00002620 BTC with converged bands, signaling muted price ranges. Weekly closes repeatedly reject the upper band near 0.00002900 BTC, reinforcing a balance between buyers and sellers rather than trend continuation.
XRP shows limited upside against Bitcoin as Bollinger Bands tighten across major timeframes, signaling consolidation over breakout momentum.
- The daily chart shows XRP at 0.00002620 BTC with narrow Bollinger Bands, signaling limited breakout potential.
- The weekly chart caps XRP near 0.00002900 BTC, with repeated rejections pointing to consolidation over outperformance.
- Monthly and four-hour charts show XRP stuck in a range as selling caps the upside and buying supports the downside.
XRP’s performance against Bitcoin is showing a familiar pattern as technical signals indicate limited chances for strong outperformance. Across several timeframes, Bollinger Bands suggest consolidation rather than a breakout.
On a daily chart, XRP is traded at 0.00002620 BTC, in the middle of the range. The Bollinger Bands have converged as opposed to expanding, and this is usually an indicator of diminished volatility. This trend suggests that traders can avoid key movements until a serious market story changes.
This is supported in the weekly chart. At the close of 0.00002900 BTC, the upper band has served as a strong resistance several times. Any efforts to take a step further have been dismissed, and the price is still stuck at 0.00002405 BTC. In having this mid-range location, the market would have considered the level as a point of equilibrium and not the beginning of another rally.
Why have longer-term patterns limited XRP’s upside versus BTC?
Historical resistance levels and repeated rejections have capped rallies since the 2017 peak. On monthly charts, rallies have become smaller and shorter, with overhead barriers consistently limiting momentum. Market structure and macro liquidity conditions have contributed to this pattern.
The monthly chart adds further weight to the analysis. XRP has been doing better than Bitcoin in the past years especially in 2017. Every rally since has however been smaller and shorter as the prices continually reach the same resistance levels in case with the Bollinger Bands. These repeated patterns show how overhead barriers have restricted upward momentum for years.
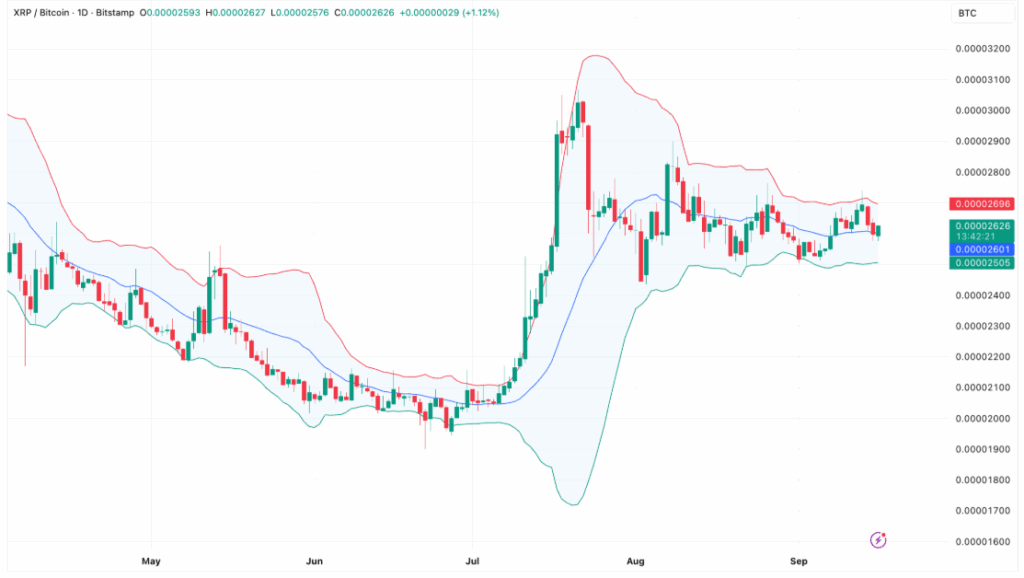
Source: TradingView
When might XRP break out against Bitcoin?
Breakout probability rises when Bollinger Bands expand and price clears the 0.00002900 BTC resistance or breaks below 0.00002405 BTC support on higher-volume moves. Traders should watch volume spikes, macro crypto flows, and regulatory or network-specific news that could act as catalysts.
What short-term levels should traders monitor?
On the four-hour chart, immediate resistance is near 0.00002720 BTC and support near 0.00002550 BTC. A sustained move beyond either level with confirming volume would increase the likelihood of a directional trend; absent that, expect continued chop inside the range.
Frequently Asked Questions
Is XRP outperforming Bitcoin right now?
As of the latest charts, XRP vs Bitcoin is not outperforming; it is range-bound with narrow Bollinger Bands and repeated rejections at weekly resistance, indicating consolidation rather than outperformance.
How should traders manage risk in a consolidating XRP/BTC market?
Use tight position sizing, place stop-losses outside the established range (above 0.00002900 BTC or below 0.00002405 BTC), and avoid chasing breakout trades until volatility and volume confirm the move.
Key Takeaways
- Consolidation dominant: Bollinger Bands narrow across daily, weekly and monthly charts, signaling low volatility.
- Defined levels: Watch 0.00002900 BTC resistance and 0.00002405 BTC support for decisive moves.
- Trade cautiously: Wait for volume-confirmed breakouts; manage risk with disciplined stops and position sizing.
Conclusion
The XRP vs Bitcoin pair remains range-bound with tightening Bollinger Bands across multiple timeframes. Historical resistance and repeated weekly rejections suggest consolidation unless a clear catalyst expands volatility. Traders should monitor specified levels and volume for breakout confirmation and follow risk management best practices.