Bitget App
Trade smarter
Open
HomepageSign up
Bitget>
News>
Ethereum (ETH) to Decline Further? Key Pattern Formation on LTF Suggests So!

Ethereum (ETH) to Decline Further? Key Pattern Formation on LTF Suggests So!

CoinsProbe2025/10/22 18:03
By: Nilesh Hembade
ETH+1.32%GMT+1.33%

Date: Wed, Oct 22, 2025 | 05:50 AM GMT

The cryptocurrency market continues to show choppy momentum, with total 24-hour liquidations reaching $655 million. Of that, $354 million came from long positions while $301 million in shorts were wiped out — a clear sign of intense two-sided volatility.

Amid this turbulence, Ethereum (ETH) has turned red again, slipping back near $3,850 after hitting a 24-hour high of $4,109. The latest technical setup on its lower timeframe now suggests that further short-term downside could be on the horizon.

Ethereum (ETH) to Decline Further? Key Pattern Formation on LTF Suggests So! image 0 Source: Coinmarketcap

Descending Triangle Pattern in Play?

On the 4-hour chart, ETH appears to be consolidating within a descending triangle pattern — a formation often seen as a bearish continuation signal. This structure features a series of lower highs pressing down on a horizontal support base, indicating waning buying momentum.

The most recent rejection from the descending trendline near $4,037 has added pressure, pushing prices down to around $3,849. Sellers currently appear to be in control as ETH struggles to reclaim higher levels.
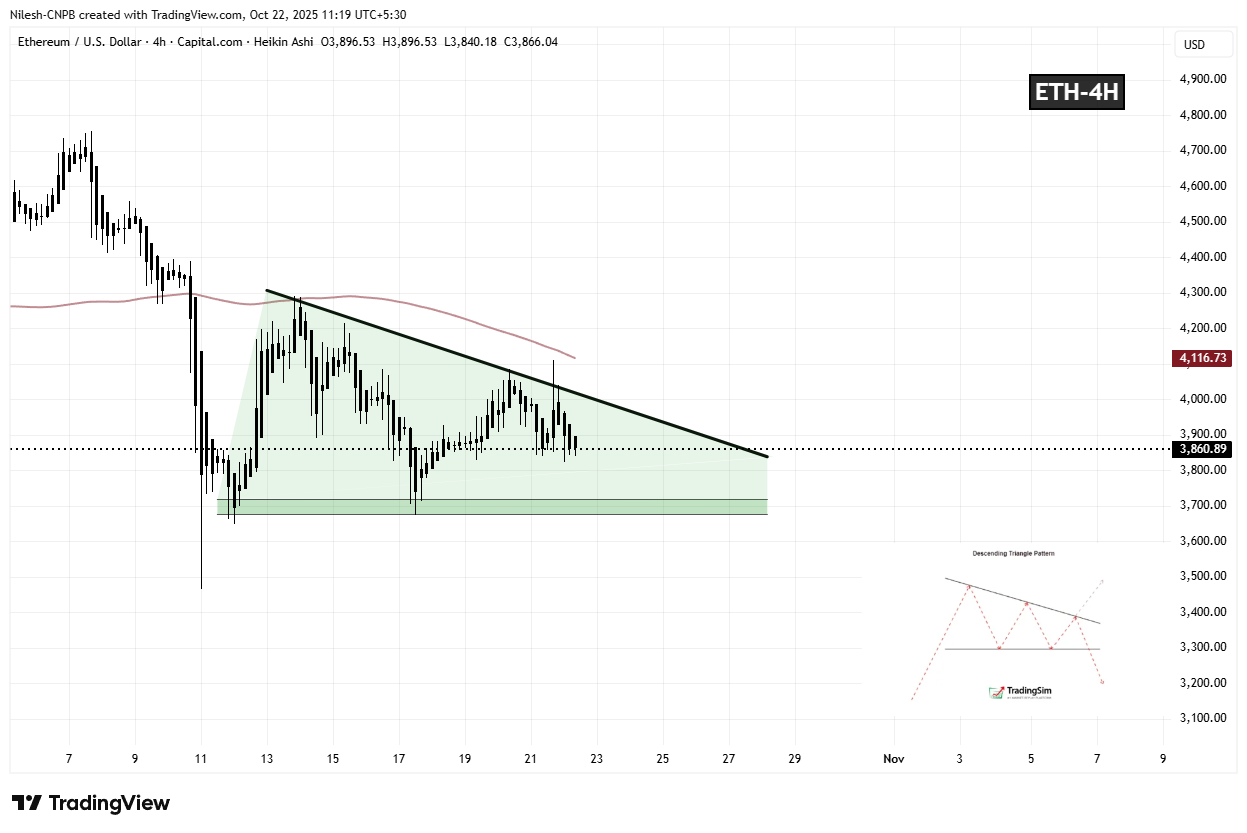
Ethereum (ETH) to Decline Further? Key Pattern Formation on LTF Suggests So! image 1 Ethereum (ETH) 4H Chart/Coinsprobe (Source: Tradingview)

What’s Next for ETH?

If downside pressure continues, a breakdown below the $3,822 support range could open the door for a deeper move toward $3,675, representing a potential 4.75% decline from current levels. This move could also weigh on the broader altcoin market, as Ethereum’s price action often influences overall sentiment.

However, if bulls manage to defend the $3,800–$3,820 zone, ETH could remain in consolidation before attempting another test of the descending resistance line. A confirmed breakout above that trendline could invalidate the bearish setup and reignite bullish momentum.

For now, the balance of risk leans slightly to the downside — but as always in crypto, volatility can quickly shift momentum in either direction.

Disclaimer: The content of this article solely reflects the author's opinion and does not represent the platform in any capacity. This article is not intended to serve as a reference for making investment decisions.
PoolX: Earn new token airdrops
Lock your assets and earn 10%+ APR
Lock now!

You may also like

Must Public Chains Embrace the Meme Trend?

The experience of Solana teaches us that "governments" should not direct the development of "enterprises."

ForesightNews 速递2025/10/23 11:33
Space Review|JST Buyback and Burn Plan Officially Launched, Ushering in a New Chapter for TRON DeFi Value

The large-scale JST buyback and burn plan has been launched, injecting protocol net income into a deflationary model to build a sustainable "value flywheel."

深潮2025/10/23 11:21
Virtuals Robotics: Why Did We Enter the Field of Embodied Intelligence?

Digital intelligence acquires physical entities, integrating thought and action in the field of robotics.

深潮2025/10/23 11:21

Trending news

More
1
Must Public Chains Embrace the Meme Trend?
2
Space Review|JST Buyback and Burn Plan Officially Launched, Ushering in a New Chapter for TRON DeFi Value

Crypto prices

More
Bitcoin
Bitcoin
BTC
$108,994.07
+1.15%
Ethereum
Ethereum
ETH
$3,849.11
+0.38%
Tether USDt
Tether USDt
USDT
$1
-0.04%
BNB
BNB
BNB
$1,090.15
+2.11%
XRP
XRP
XRP
$2.38
-0.66%
Solana
Solana
SOL
$187.35
+1.21%
USDC
USDC
USDC
$0.9999
-0.02%
TRON
TRON
TRX
$0.3218
+0.49%
Dogecoin
Dogecoin
DOGE
$0.1926
+0.78%
Cardano
Cardano
ADA
$0.6335
-0.40%
How to buy BTC
Bitget lists BTC – Buy or sell BTC quickly on Bitget!
Trade now
Become a trader now?A welcome pack worth 6200 USDT for new users!
Sign up now
Trade smarter