Bitcoin Bottom in Sight? Technicals and Lunar Cycles Point to November Reversal
Bitcoin (BTC) traders anticipate a local bottom forming in mid-November, as the 50-day simple moving average (SMA) is set to cross below the 200-day SMA near $100,000, a pattern that has often marked local bottoms.
In addition, some analysts are overlaying lunar phases on price charts, noting that First Quarter moons often precede rallies extending into Full or Third Quarter moons. These contrasting strategies, classic technical analysis and the use of lunar phase timing, are capturing attention as Bitcoin tests critical supports.
Death Cross and Key Support Levels Indicate November Bottom
The expected intersection of Bitcoin’s 50-day and 200-day SMAs, often called a death cross, could occur in mid-November near $100,000. Historically, this event signals local bottoms and does not usually mark long-term downturns.
According to Binance’s analysis, the average price change one month after a death cross is just -3.2%, challenging the idea that it reliably triggers lasting bear markets.
Analyst Colin suggests the lowest reasonable level for Bitcoin in this bull market cycle is around $98,000, a region with multiple support alignments. This matches with the 50-week SMA, which has provided support since Q1 2023.
It looks like a $BTC bottom could be reached mid-November.This is based on when the 50 day SMA (blue line) and 200 day SMA (white line) are roughly projected to intersect, which has marked most past local bottoms.Furthermore, the lowest I can see BTC reasonably going (and… pic.twitter.com/9WWvEFIxLH
— Colin Talks Crypto 🪙 (@ColinTCrypto) October 30, 2025
Binance data from October 2025 indicates that the 50-week SMA is approximately $101,700, a key level during the ongoing bull market.
Since Q1 2023, Bitcoin has not closed a weekly candle beneath the 50-week SMA, a point highlighted by analyst Ted Pillows in his October post. This level, now around $102,800, serves as the threshold Bitcoin must hold to maintain the bull run.
$BTC hasn't closed a weekly candle below 50 SMA since Q1 2023.This is the level Bitcoin needs to hold for this bull run to continue. pic.twitter.com/jW9LuutAl5
— Ted (@TedPillows) October 30, 2025
A weekly close below this support level could indicate a potential downturn in market structure.
Rising Wedge Formation Could Lead to 15-35% Dip
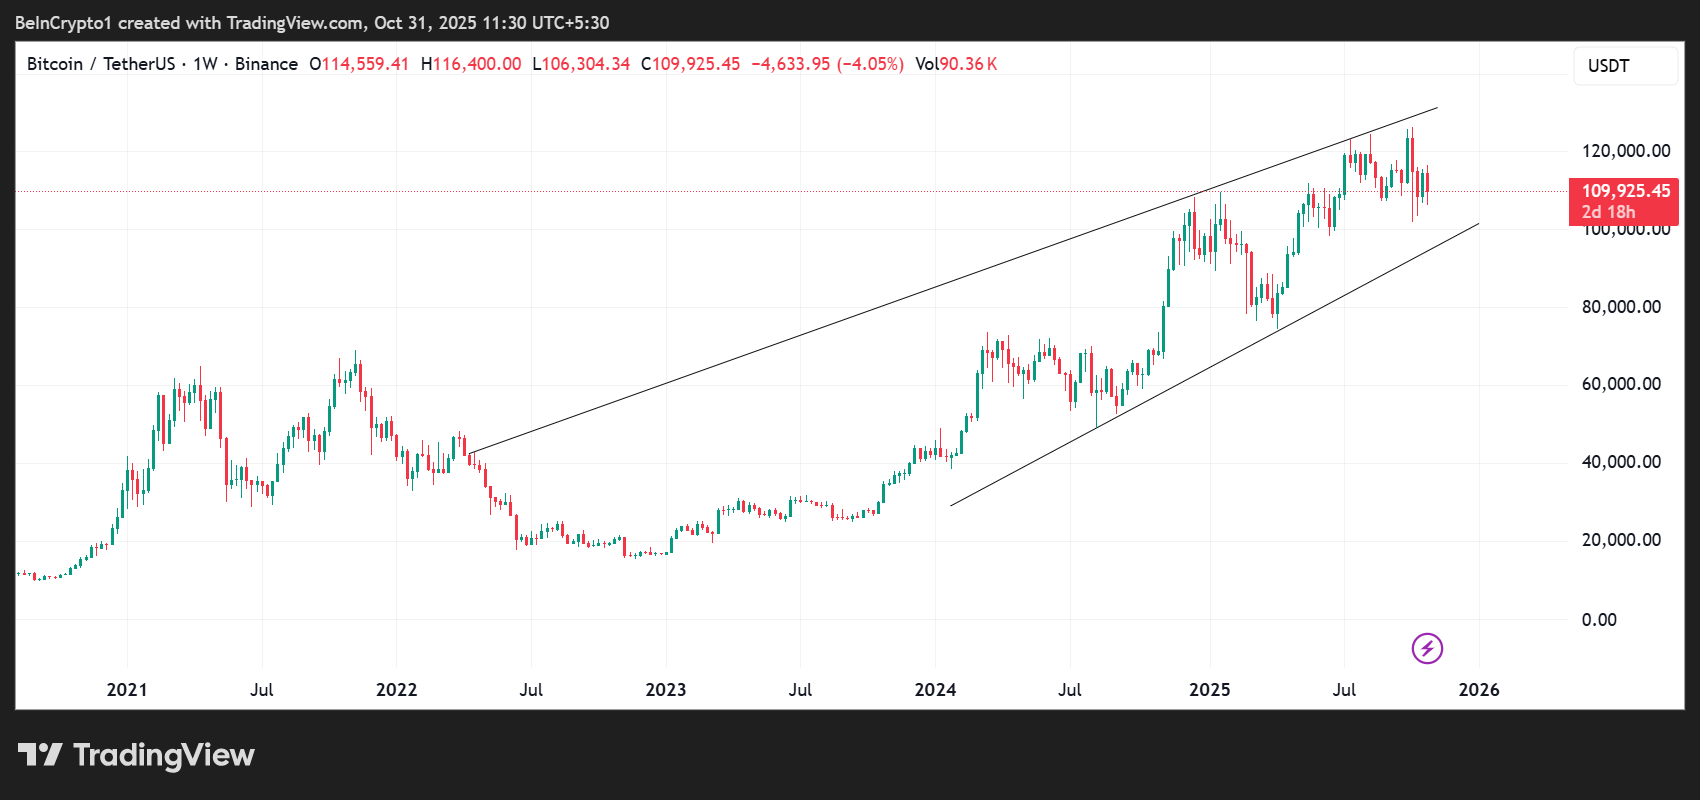
Despite positive long-term signals, Bitcoin’s weekly chart now displays a rising wedge, a bearish pattern characterized by converging trendlines that indicate waning momentum.
 Bitcoin (BTC) Price Performance. Source: TradingView
 In previous cycles, this setup has resulted in declines ranging from 15% to 35%, as observed in both 2018 and 2021. The pattern suggests weaker buying pressure at increasingly higher prices within a narrowing range.
Still, the overall bull market structure holds. Bitcoin continues to record higher lows and higher highs within an ascending channel since 2022.
Historically, bounces from the channel’s lower range have rebounded 60% to 170%. Some analysts maintain a price target of $170,000 or higher, crediting this strong uptrend and the absence of overbought cycle signals traditionally seen at macro tops.
The current sideways trading between $105,000 and $110,000 is viewed as a consolidation, rather than a market breakdown.
Colin’s analysis suggests the market is testing holders’ patience, especially for altcoin investors, as the cycle stretches beyond a standard Q4 peak. He notes Bitcoin bucked precedent in the last bear market when its low of $15,000 fell below the former cycle’s top of $20,000, a first for the digital asset.
Lunar Cycle Observations Add to Bullish Case
Some traders also match Bitcoin’s price patterns with lunar phases. Analyst LP_NXT shared an analysis illustrating that when Bitcoin is mapped alongside moon cycles, a clear rhythm emerges for 2025.
First Quarter moons, including the recent October 29 event, have often corresponded with the beginning of upward moves extending into the Full or Third Quarter moon periods.
$BTC — Lunar Cycle Theory 🌕If you overlay Bitcoin’s price action with the moon phases, there’s a clear rhythm that’s repeated all year.Each First Quarter Moon often marks the start of a new cycle — historically followed by a rally that extends into the Full Moon or Third… pic.twitter.com/KTAD99Jzh7
— LP (@LP_NXT) October 30, 2025
The First Quarter moon on October 29, 2025, could thus align with a bullish trend according to this theory. This timing aligns with the technical view that mid-November could mark the local bottom.
Supporters attribute these cycles to recurring market psychology rather than superstitious reasoning. Although lunar phase analysis lacks the rigor of established technical tools, its recurrence among traders highlights the diverse range of strategies employed in crypto markets.
The alignment of lunar timing, established support levels, and moving average crossovers makes November 2025 a focal point for traders.
Bullish Structure Holds as Market Consolidates
Current market conditions balance short-term bearish technicals with long-term bullish momentum. Colin’s analysis highlights the importance of patience, suggesting that market shakeouts may occur for those seeking a traditional Q4 peak.
He recommends holding Bitcoin until a new all-time high is reached, then potentially rotating into altcoins using Bitcoin-denominated gains a few weeks later.
The so-called death cross, while generally seen as negative, acts more as a lagging confirmation in Bitcoin’s history.
Meanwhile, Ledger’s educational materials point out that it often signals capitulation (exhausted selling and reversal) rather than forecasting major moves in advance.
As October 2025 concludes, Bitcoin’s ability to remain above the 50-week SMA will determine the bull market’s path.
The mid-November window, suggested by both moving average analysis and lunar timing, provides traders with a timeframe for potential accumulation. Whether traditional or unconventional methods prove accurate, November 2025 is shaping up to be a decisive period for Bitcoin price action.