Date: Sat, Nov 01, 2025 | 06:10 PM GMT
The cryptocurrency market is starting the new month on a steady note, with Bitcoin (BTC) and Ethereum (ETH) both trading in green. Some altcoins are following the positive sentiment — including Artificial Superintelligence Alliance (FET) which is showing early signs of strength.
FET has jumped by more than 10% today, and while that alone is notable, the more interesting development lies in its chart structure — which now signals a possible upside breakout in the near term.
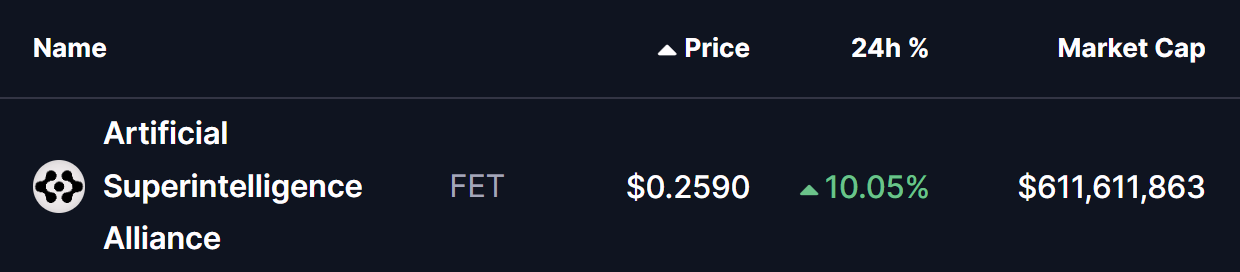 Source: Coinmarketcap
 Descending Broadening Wedge Pattern in Play
On the 2-hour chart, FET has been trading within a descending broadening wedge — a bullish technical pattern that forms during a downtrend and often hints at a reversal once the price breaks above the upper resistance line.
During its recent decline, FET successfully tested the lower wedge support near $0.2311, where buyers strongly defended the level. Since then, the token has bounced sharply, recovering to around $0.2590 — just below the upper wedge boundary.
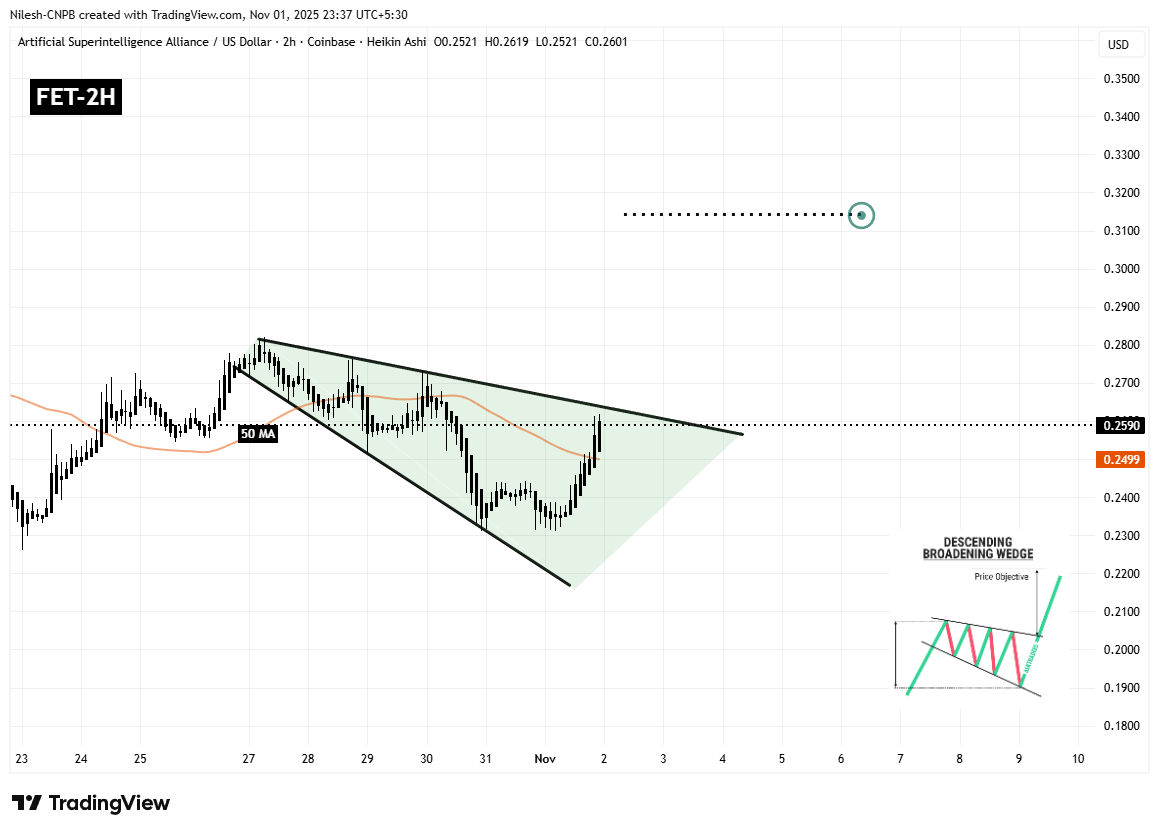 FET 2H Chart/Coinsprobe (Source: Tradingview)
 The price action is now tightening near this upper trendline, creating conditions that frequently precede explosive directional moves.
Adding further strength to the setup, FET has also reclaimed its 50-hour moving average (MA) near $0.2499, which is now acting as short-term support. This level could serve as a springboard for buyers if the token experiences minor intraday pullbacks.
What’s Next for FET?
If bulls manage to break above the upper wedge resistance and sustain price action above the 50-hour MA, it would confirm a bullish reversal pattern — potentially setting the stage for a rally toward the $0.3143 region. That would represent roughly a 21% upside from current levels.
However, if FET faces rejection at the wedge’s resistance, it could remain range-bound for some time. In that case, $0.2499 becomes the crucial level for buyers to hold in order to maintain short-term momentum.
For now, the overall technical setup appears constructive, and with broader market sentiment leaning positive, FET could soon join the list of altcoins gearing up for a potential breakout phase.