Date: Wed, Nov 05, 2025 | 05:25 AM GMT
The cryptocurrency market is showing minor signs of relief after a sharp sell-off witnessed on last tow days that pushed Bitcoin (BTC) down to the $98K region before rebounding to around $102K. Total liquidations have now crossed the $2 billion mark, reflecting the intense volatility sweeping across the derivative market.
This broad market pressure has also impacted major altcoins like Solana (SOL), which slipped over 4% today and remains down 31% for the month. However, with this extended decline, Solana’s current technical structure hints that the token might be preparing for a potential bullish reversal.
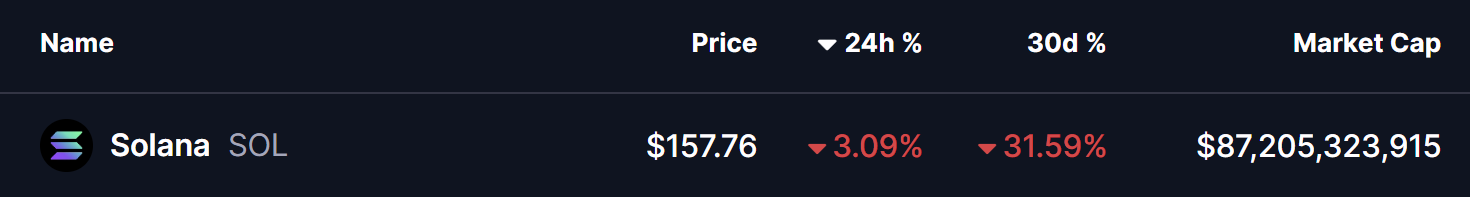 Source: Coinmarketcap
 Falling Wedge Pattern in Play
On the daily chart, SOL appears to be following a falling wedge pattern — a classic technical setup that typically signals selling exhaustion followed by the potential for a strong upside breakout.
The recent correction brought Solana down to the wedge’s lower boundary near $145.81, which has acted as a solid support zone. From this point, SOL has managed to bounce back toward $157.70, suggesting that buyers are actively defending this crucial level.
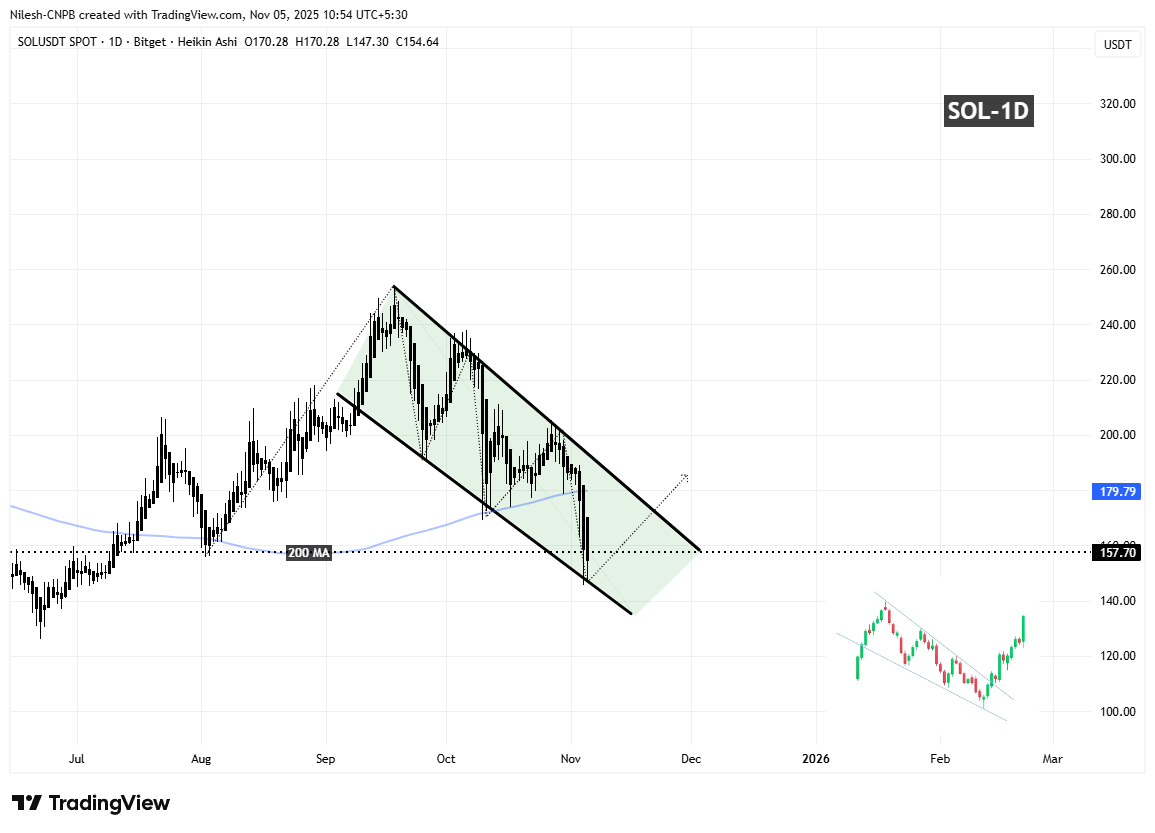 Solana (SOL) Daily Chart/Coinsprobe (Source: Tradingview)
 What’s Next for SOL?
If Solana maintains its footing above the wedge’s support trendline, traders may soon look for a move toward the upper boundary of the pattern. A confirmed breakout above this resistance could set the stage for a broader bullish reversal, potentially driving the price toward the 200-day Moving Average (MA) near $179.79 — a key level to watch for trend confirmation.
For now, holding above the wedge support remains the most critical condition for Solana’s bullish case. Losing this level could delay any potential rebound and expose SOL to further downside pressure before a recovery attempt.