Bitget App
Trade smarter
Open
HomepageSign up
Bitget>
News>
Markets>
Pi Network (PI) Approaches Key Resistance – Is a Breakout on Horizon?

Pi Network (PI) Approaches Key Resistance – Is a Breakout on Horizon?

CoinsProbe2025/11/26 08:54
By: Nilesh Hembade
ETH-7.97%PI-6.87%

Date: Wed, Nov 26, 2025 | 06:15 AM GMT

The cryptocurrency market continues its steady recovery following last week’s sharp volatility, which dragged Ethereum (ETH) to a low of $2622 before rebounding toward $2950. This recovery is now helping several altcoins regain strength, including Pi Network (PI) , which is beginning to flash an interesting technical pattern on its daily chart.

PI is currently trading with a modest 4% intraday gain, but beyond the price jump, the structure forming on the chart is what truly stands out — suggesting that a larger move may be developing soon.

Pi Network (PI) Approaches Key Resistance – Is a Breakout on Horizon? image 0 
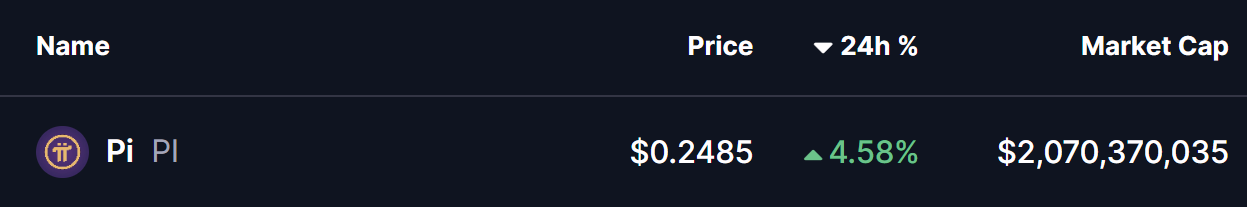
Source: Coinmarketcap

Symmetrical Triangle in Play

On the daily chart, PI has been moving inside a symmetrical triangle, a pattern known for tightening price action and eventually leading to a forceful breakout in either direction. Unlike descending or ascending triangles, this formation is neutral, but its breakout signals often come with significant volatility.

During the recent pullback, PI dipped toward the triangle’s lower support near $0.2160. This trendline has been a reliable buffer throughout the consolidation phase, and once again, buyers defended it strongly. The rebound from this zone has pushed PI back toward $0.2485, placing the price directly beneath the triangle’s upper resistance trendline.

Pi Network (PI) Approaches Key Resistance – Is a Breakout on Horizon? image 1 
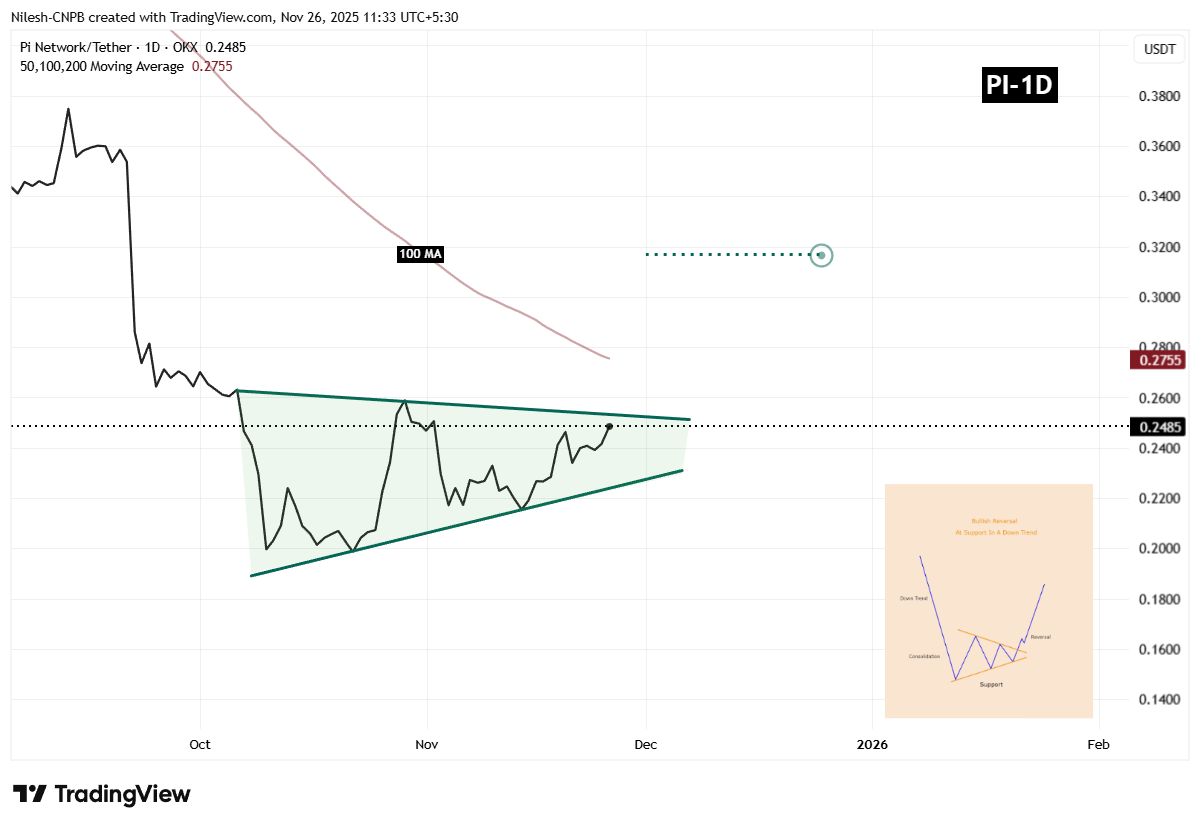
Pi Network (PI) Daily Chart/Coinsprobe (Source: Tradingview)

The closer PI moves toward this resistance while maintaining higher lows, the more momentum builds for a potential breakout. This tightening structure suggests rising pressure that could soon resolve with a decisive move.

What’s Next for PI?

If bulls manage to push PI above the triangle’s upper resistance line and reclaim the 100-day Moving Average near $0.2755, it would confirm a bullish breakout from the pattern. Once this confirmation occurs, the next key target sits around $0.3169, offering more than 27% potential upside from current levels based on the pattern’s measured projection.

However, if PI struggles to break through resistance, the price may continue to consolidate inside the triangle. In that case, the $0.2280 zone becomes the important short-term support area to watch for any renewed buying pressure.

Disclaimer: The content of this article solely reflects the author's opinion and does not represent the platform in any capacity. This article is not intended to serve as a reference for making investment decisions.
PoolX: Earn new token airdrops
Lock your assets and earn 10%+ APR
Lock now!

You may also like

Goldman Buys Leading ETF Innovator to Capitalize on Growth in Active Investing

- Goldman Sachs acquires Innovator Capital Management for $2 billion in cash and equity, expanding its active ETF portfolio with $28 billion in assets under supervision. - The deal strengthens Goldman's position in structured ETFs, a 66% CAGR niche market offering downside protection and yield enhancement strategies since 2020. - Innovator's leadership in defined-outcome ETFs aligns with Goldman's strategy to capitalize on shifting investor demand for active management amid tighter monetary policy. - The a

Bitget-RWA2025/12/01 15:41
Ethereum Updates Today: BitMine Bets Big on Fusaka for Ethereum, Aiming for 5% Treasury Allocation

- BitMine, led by Tom Lee, holds 3.63M ETH (3.1% of supply) as of November 2025, aiming to control 5% of Ethereum through aggressive buying ahead of the Fusaka upgrade. - The firm's $12.1B crypto portfolio includes 39% weekly ETH purchases, but faces $4-4.2B unrealized losses amid Ethereum's 30% monthly price decline. - Upcoming Fusaka upgrade (Dec 3) and 2026's MAVAN staking network aim to boost ETH demand, while equity dilution and crypto market volatility have driven BitMine's stock down 80% from peak.

Bitget-RWA2025/12/01 15:41
Bitcoin Updates Today: Bitcoin Faces Uncertain Drop as Large Holders, Market Signals, and Federal Reserve Actions Strengthen Bearish Outlook

- Bitcoin faces critical support at $93,000; analysts warn a break could trigger deeper correction toward $70,000 or $40,000. - Whale inflows to Binance ($7.5B in 30 days) and thinning liquidity signal potential sell-offs, mirroring 2025's crash pattern. - JPMorgan's macro asset classification and Peter Brandt's bearish technical analysis highlight growing institutional caution. - Fed policy uncertainty and global regulations compound risks, though long-term optimism persists amid 2026 growth projections.

Bitget-RWA2025/12/01 15:41

Trending news

More
1
Goldman Buys Leading ETF Innovator to Capitalize on Growth in Active Investing
2
Ethereum Updates Today: BitMine Bets Big on Fusaka for Ethereum, Aiming for 5% Treasury Allocation

Crypto prices

More
Bitcoin
Bitcoin
BTC
$84,020.32
-8.10%
Ethereum
Ethereum
ETH
$2,728.71
-9.92%
Tether USDt
Tether USDt
USDT
$1
+0.01%
XRP
XRP
XRP
$1.99
-9.21%
BNB
BNB
BNB
$803.9
-9.99%
USDC
USDC
USDC
$1.0000
+0.00%
Solana
Solana
SOL
$123.49
-10.61%
TRON
TRON
TRX
$0.2769
-2.02%
Dogecoin
Dogecoin
DOGE
$0.1326
-11.20%
Cardano
Cardano
ADA
$0.3728
-11.62%
How to buy BTC
Bitget lists BTC – Buy or sell BTC quickly on Bitget!
Trade now
Become a trader now?A welcome pack worth 6200 USDT for new users!
Sign up now
Trade smarter