- BNB’s recent token burn removes $971M worth, impacting supply and potentially boosting value.
- BNB consolidates between $590-$600, with key resistance at $600 and support at $585.
- RSI at 57.94 indicates neutral market, while MACD suggests short-term bullish momentum for BNB.
The BNB Foundation recently completed its 28th quarterly BNB token burn, a significant milestone for the BNB Chain. As reported by Colin Wu, this burn removed 1,643,698.8 BNB from circulation, valued at approximately $971 million. The burn amount is adjusted based on the BNB price and the number of blocks generated on the Binance Smart Chain (BSC) during the quarter.
Currently, BNB is trading at $593.10 , with a market capitalization of roughly $86.55 billion, a slight 1.05% decrease over recent days. However, trading volume has surged by 23.73% to $1.90 billion, signaling growing investor interest and potential price volatility.
Analyzing BNB’s price trend reveals a consolidation phase between $590 and $600, a critical range that could determine the cryptocurrency’s next move. Key support levels are at $585 and $590, with the price demonstrating resilience at $585, often rebounding quickly from this level.
Similarly, the $590 mark has served as a minor support level, where the price briefly touched before climbing higher. A stronger support level appears at $580, where buying interest has historically increased, creating a solid floor for the price.
On the resistance front, the $600 mark acts as a psychological barrier, with the price facing considerable selling pressure at this level. A breakthrough above $600 could target $605 and $610.
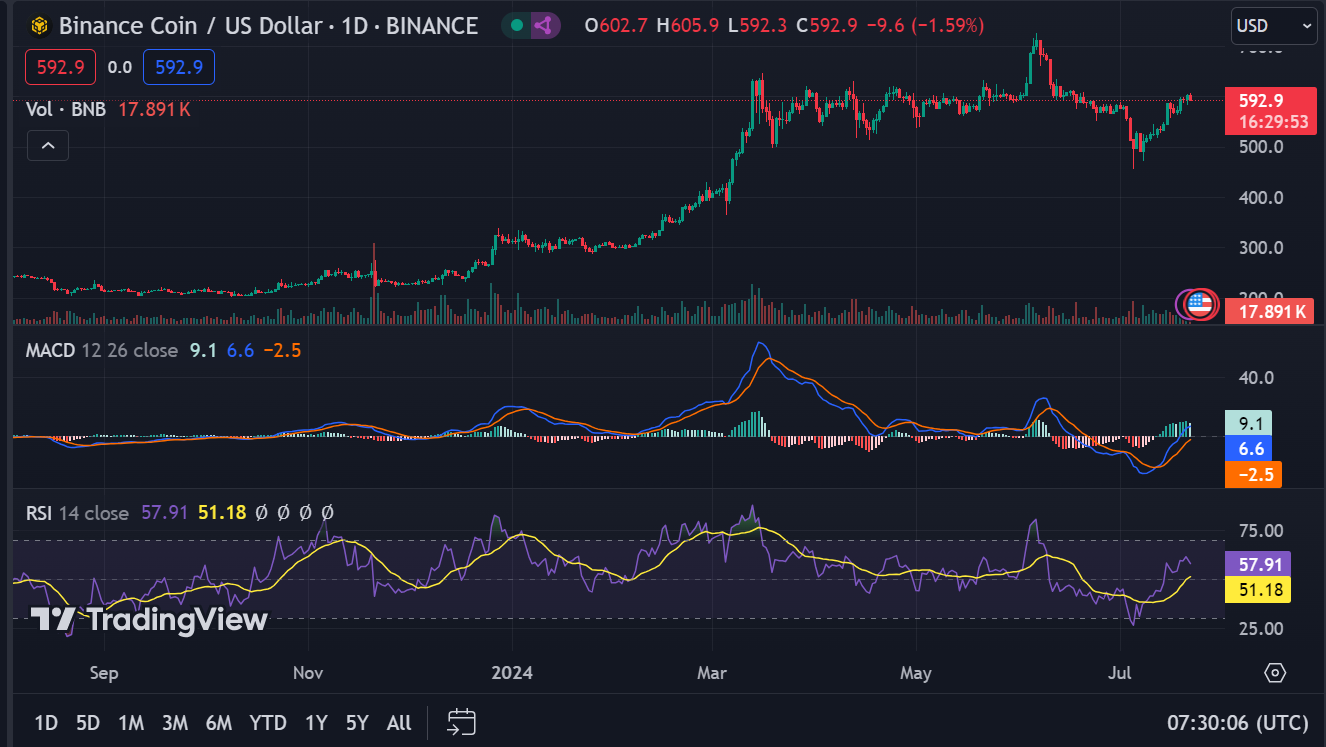
BNB/USD 1-day price chart, Source: Trading view
Currently, the 1-day Relative Strength Index (RSI) for BNB reads 57.94. This indicates a neutral trading position, suggesting that BNB is neither overbought nor oversold. Meanwhile, the 1-day Moving Average Convergence Divergence (MACD) is trading above its signal line, hinting at potential bullish momentum in the short term.
Disclaimer: The information presented in this article is for informational and educational purposes only. The article does not constitute financial advice or advice of any kind. Coin Edition is not responsible for any losses incurred as a result of the utilization of content, products, or services mentioned. Readers are advised to exercise caution before taking any action related to the company.