- Inactive Supply Shift Index shows reduced selling, signaling potential Bitcoin stabilization.
- Long-term holder activity in the index correlates strongly with Bitcoin price movements.
- Puell Multiple at 0.4 hints Bitcoin may be near a bottom, ideal for long-term accumulation.
Recent data from CryptoQuant has shed light on a metric known as the “Inactive Supply Shift Index,” which offers an approach to analyzing Bitcoin market risks. This index, closely crafted by analyzing historical Bitcoin blockchain data, could redefine how traders and analysts interpret market dynamics.
The Inactive Supply Shift Index measures the weekly changes in Bitcoin’s inactive supply, focusing on periods ranging from one to seven years. By tracking these changes, the index provides valuable insights into the behavior of long-term holders.
Notably, the index recently reverted to near-zero levels after a phase of deep negative readings, which previously coincided with Bitcoin’s price surge past $70,000.
The Inactive Supply Shift Index reveals two critical phases in Bitcoin’s market behavior. During periods of deep negative values, long-term holders who had accumulated Bitcoin over the years began selling as prices reached new heights. This increased selling pressure is often seen as a response to capitalizing on market peaks, contributing to price volatility.
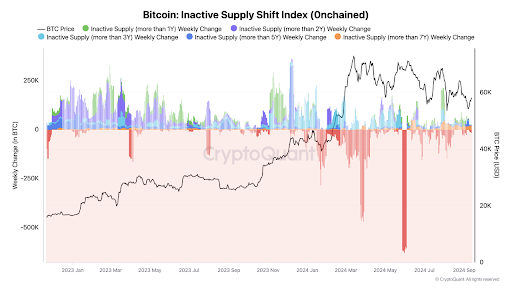 Source: CryptoQuant
 However, the index’s return to near-zero levels points to a reduction in selling pressure. This shift shows a stabilization phase where the influx of Bitcoin from long-term stashes diminishes, potentially paving the way for market equilibrium and renewed buyer interest, assuming market demand remains strong.
Correlation with Bitcoin Price
The index’s fluctuations have significantly correlated with Bitcoin’s price movements. The substantial spikes in inactive supply, especially in more than seven years, often coincided with sharp declines in Bitcoin prices. This pattern suggests that long-term holders’ actions, such as reactivating dormant Bitcoin, may influence market dynamics and contribute to price fluctuations.
Read also: Bitcoin Buy-Sell Ratio Soars on Kraken and Coinbase: Bullish Signal?
Adding to this sentiment, CryptoQuant also highlighted the Puell Multiple, another crucial metric that recently reached the 0.4 range for the first time since the end of 2022.
The Puell Multiple, which compares daily Bitcoin issuance to its 365-day moving average, is often used to spot potential market tops and bottoms. The current reading near 0.4 could indicate that Bitcoin is nearing a market bottom, making it a potentially favourable time for long-term accumulation
Disclaimer: The information presented in this article is for informational and educational purposes only. The article does not constitute financial advice or advice of any kind. Coin Edition is not responsible for any losses incurred as a result of the utilization of content, products, or services mentioned. Readers are advised to exercise caution before taking any action related to the company.