Date: Mon, Nov 03, 2025 | 01:45 PM GMT
The cryptocurrency market is facing its typical Monday volatility, giving back weekend gains as both Bitcoin (BTC) and Ethereum (ETH) extend their pullbacks. Over $542 million worth of positions have been liquidated in the past 24 hours, with a massive $476 million coming from long orders — reflecting increased market stress and uncertainty among leveraged traders.
ETH has slipped more than 3% today, but what’s capturing attention now is its behavior near a crucial support level, one that could determine whether a reversal or deeper decline comes next.
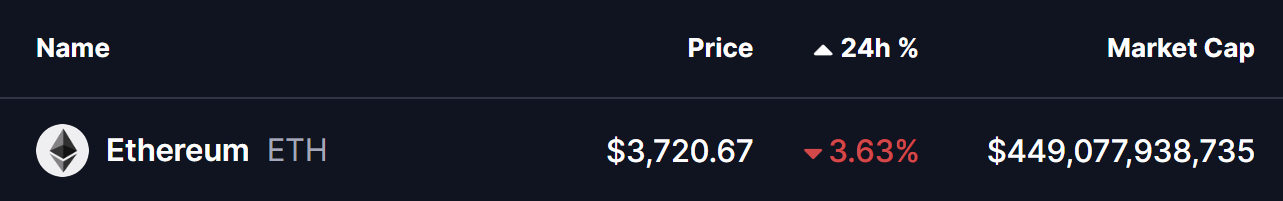 Source: Coinmarketcap
 Double Bottom Pattern in Play?
On the 4-hour chart, Ethereum appears to be forming a Double Bottom pattern, a bullish reversal setup that often emerges after extended downtrends.
The latest leg down started from the $3,916 neckline resistance, pushing ETH to retest the $3,686 zone — an area that also marked the first bottom earlier last week. The price’s rebound from this level could potentially complete the second bottom, signaling that bears may be losing control.
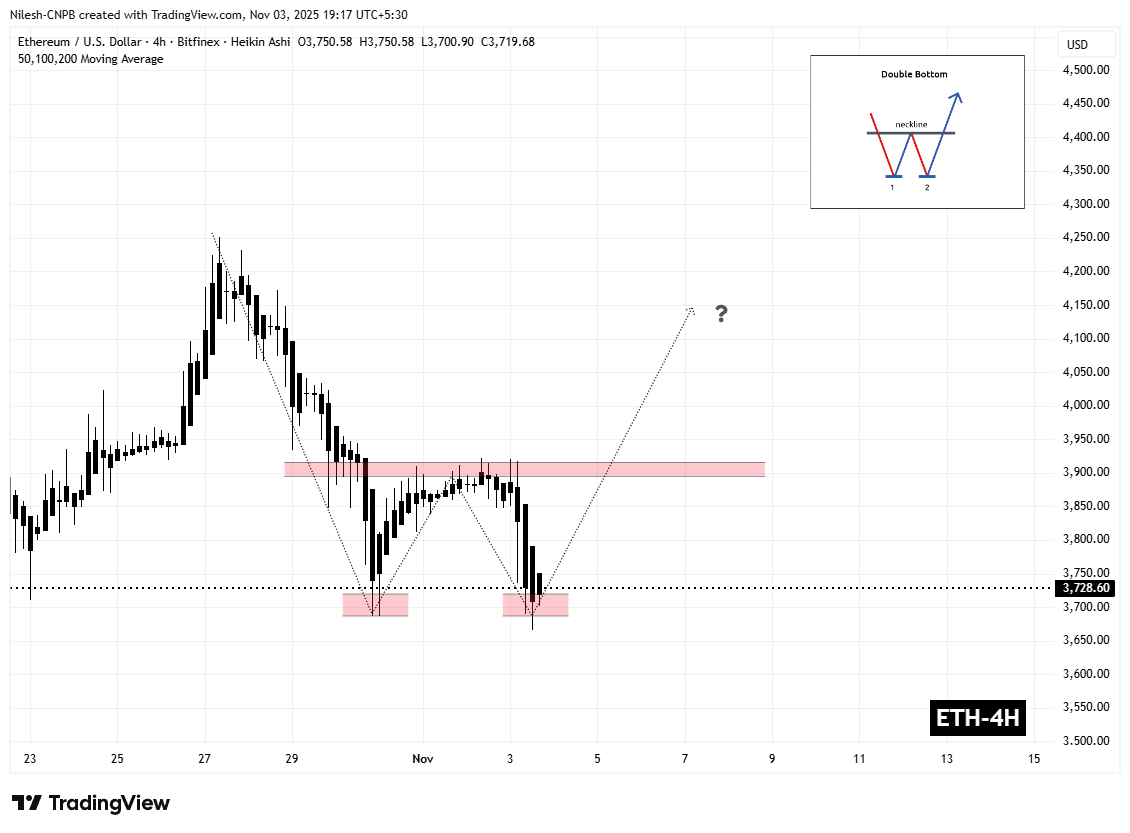 Ethereum (ETH) 4H Chart/Coinsprobe (Source: Tradingview)
 At the time of writing, ETH trades around $3,728, showing early signs of stability and hinting that buyers are stepping back in to defend this level.
What’s Next for ETH?
If ETH successfully holds above the $3,680–$3,660 support and pushes through the neckline, the breakout could pave the way for a rally toward $4,145, which represents an 11% upside from current levels.
However, traders should remain cautious. A failure to hold this critical support range would invalidate the bullish setup, potentially triggering a deeper retracement before any recovery attempt.
For now, the chart setup leans bullish, but confirmation lies in how ETH reacts to the neckline area — a make-or-break level that could define the coin’s short-term direction.