Here’s How Low ETH Can Go if $3.5K Fails to Hold Selling Pressure (Ethereum Price Analysis)

Ethereum has recently breached a significant resistance level, crossing the psychological milestone of $4K and achieving a new high for the year.
However, this breakthrough was met with resistance, leading to a noticeable correction. The question that arises now is whether this correction is merely a temporary setback or the beginning of a broader reversal in the bullish trend.
Technical Analysis
By Shayan
The Daily Chart
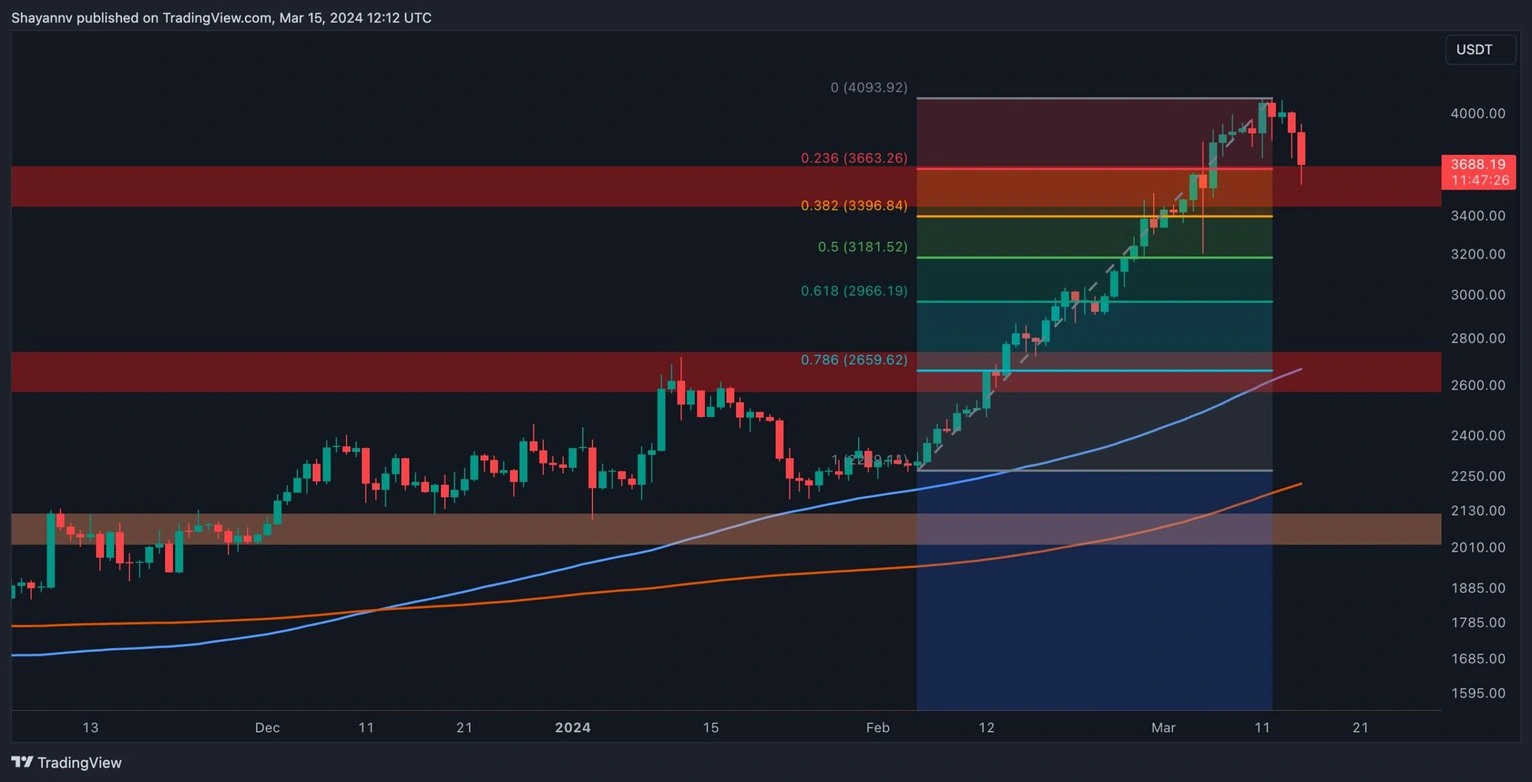
A thorough analysis of the daily chart indicates a prevailing bullish sentiment surrounding Ethereum, evident in a strong and sudden upward surge that surpassed the critical resistance at $4K. This surge reflects heightened interest from market participants in Ethereum, resulting in increased volatility.
However, after briefly surpassing the crucial $4K resistance level, the price encountered intensified selling pressure, likely due to profit-taking among participants, leading to a significant decline toward the substantial support zone of around $3.5K. It seems likely that the market will find support in this region and initiate a fresh rally.
However, in the event of a continued corrective retracement, Ethereum’s price is expected to find support around key levels within the Fibonacci retracement, specifically between the 0.5 ($3,181) and 0.618 ($2,966) levels.
The 4-Hour Chart
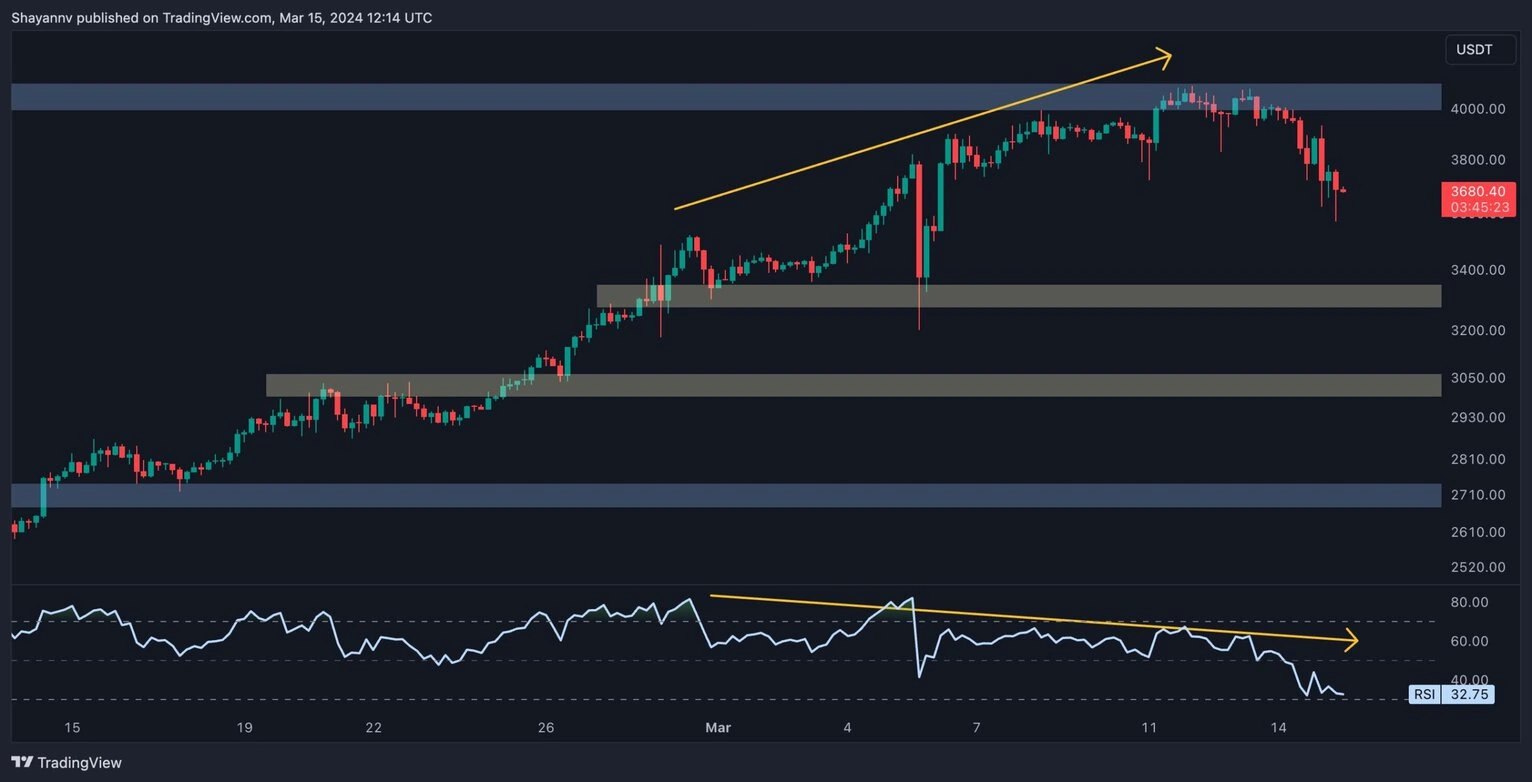
Further examination of the 4-hour chart confirms the presence of buyers in the Ethereum market, propelling the price to its highest level since April 2022. This surge, accompanied by increased market volatility, demonstrates significant buying interest aimed at surpassing the previous all-time high of $4.8K.
However, following the breakthrough above the critical $4K resistance level, the price faced rejection, leading to a sharp decline aiming for the key support zones around $3.5K and $3.3K. Additionally, an expanding bearish divergence between the price and the RSI indicator suggests the potential for a notable market correction.
Nevertheless, it is important to recognize that healthy bullish markets often experience periods of consolidation correction, allowing the asset to rest and rebuild demand. Therefore, it seems likely that the price will find support in the medium term, continuing its overall upward trend.
On-chain Analysis
By Shayan
Ethereum’s price has surged rapidly in recent weeks, briefly surpassing its previous all-time high of $4,000. This surge has attracted numerous speculators to the market, driving up buying pressure and instilling confidence among investors.
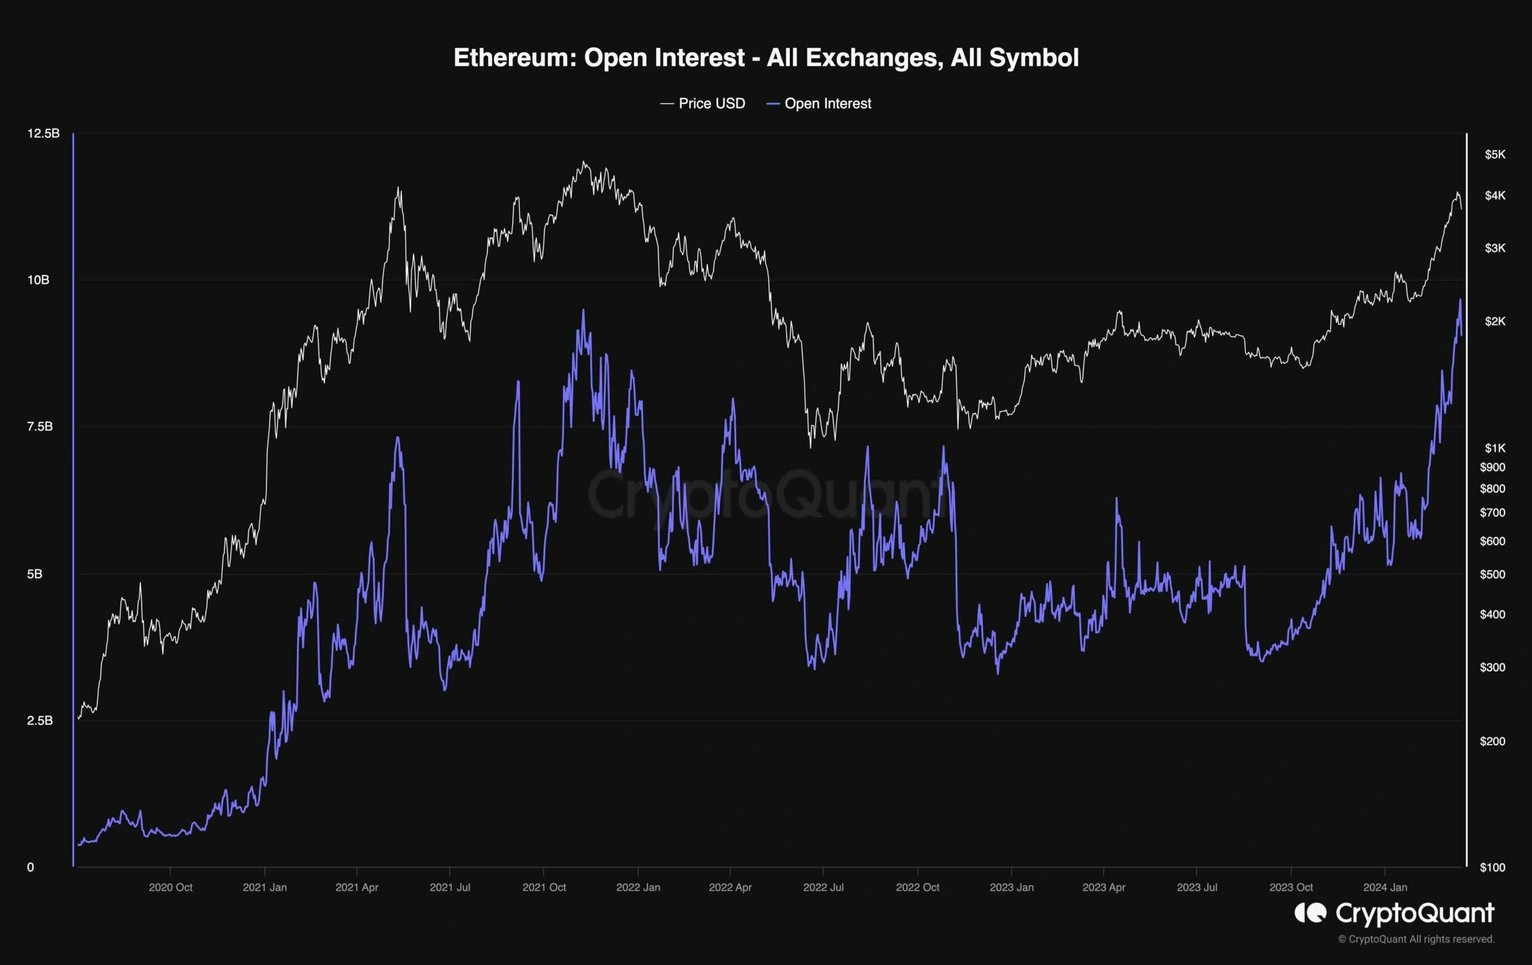
The accompanying chart illustrates the open interest, a valuable metric for assessing sentiment in the futures market. Open interest quantifies the number of outstanding perpetual futures contracts across various crypto exchanges.
It’s evident that the open interest has soared alongside the recent bullish trend, reaching unprecedented levels. This surge indicates the intensity of both long and short positions in the perpetual futures market, resulting in an overheated environment.
While elevated open interest is typical in a robust bull market, it can also contribute to heightened volatility and unexpected market corrections. As such, it’s prudent for investors to carefully manage their risk in the short term.
Disclaimer: The content of this article solely reflects the author's opinion and does not represent the platform in any capacity. This article is not intended to serve as a reference for making investment decisions.
You may also like
Dive into the Crypto World: PUMP and WLFI Coins Soar with Unmatched Potential
In Brief WLFI and PUMP Coins took opposite paths post-listing in the crypto market. PUMP Coin sees potential growth via its buyback strategy and rising market interest. WLFI benefits from strong backing but faces questions on current market values.

Ethereum's Fusaka update slated for December 3rd, 2025

Alts Are Hard to Hold: 5 Altcoins Worth Accumulating for 500%+ Gains Through Uncertainty

DFDV Commits $75M to Solana DATs via Treasury Accelerator
DFDV launches Treasury Accelerator, backing Solana DATs with $75M and recycling profits into $SOL.Profits Will Flow Back Into Solana ($SOL)Accelerating Solana’s DeFi Ecosystem