
The Turbo price has pumped by 45% over the last 24 hours to trade at $0.006314 as of 8:00 a.m. EST.
Turbo Price Prediction: Where Next?
Analysing Turbo price charts, we see that the Turbo price has been consistently touching or staying near the upper Bollinger Band at 0.006381, indicating strong bullish momentum.
The middle band, currently at 0.006202, is acting as a support level, showing that the price has been maintained above this level, indicating a continued uptrend. The lower band is around 0.006023, showing the range within which the price could fall if there is a reversal.
The price has shown a consistent upward trend, with minor pullbacks, maintaining its position near the upper Bollinger Band. This suggests intense buying pressure. The ADX is at 34.97, indicating a strong trend. ADX values above 25 generally indicate a strong trend, up or down.
The rising ADX line suggests that the current bullish trend is gaining strength.
On the other hand, the volume oscillator is at 44.65%, indicating an increase in volume relative to the short-term average. The rising Volume Oscillator suggests increasing buying interest, which supports the bullish momentum.
The chart shows a solid upward trend for TURBO/USD in the 15-minute timeframe, with the price consistently trading near the upper Bollinger Band. The ADX indicates a strong trend, and the rising Volume Oscillator and high Volume SMA confirm increasing buying interest.
The price staying near the upper Bollinger Band indicates bullish, solid momentum. The ADX value above 25 indicates a strong trend, and its rising nature suggests increasing trend strength.
Turbo Price: Potential Risks
The rising Volume Oscillator and high Volume SMA suggest increasing buying interest and strong trading volume. A potential risk is if the price fails to maintain above the middle Bollinger Band (0.006202), which could indicate a loss of momentum and a possible pullback.
The price may continue to rise if it maintains above the middle Bollinger Band and the ADX continues to rise, indicating strong bullish momentum. If the price breaks below the middle Bollinger Band, it could indicate a potential reversal or consolidation phase.
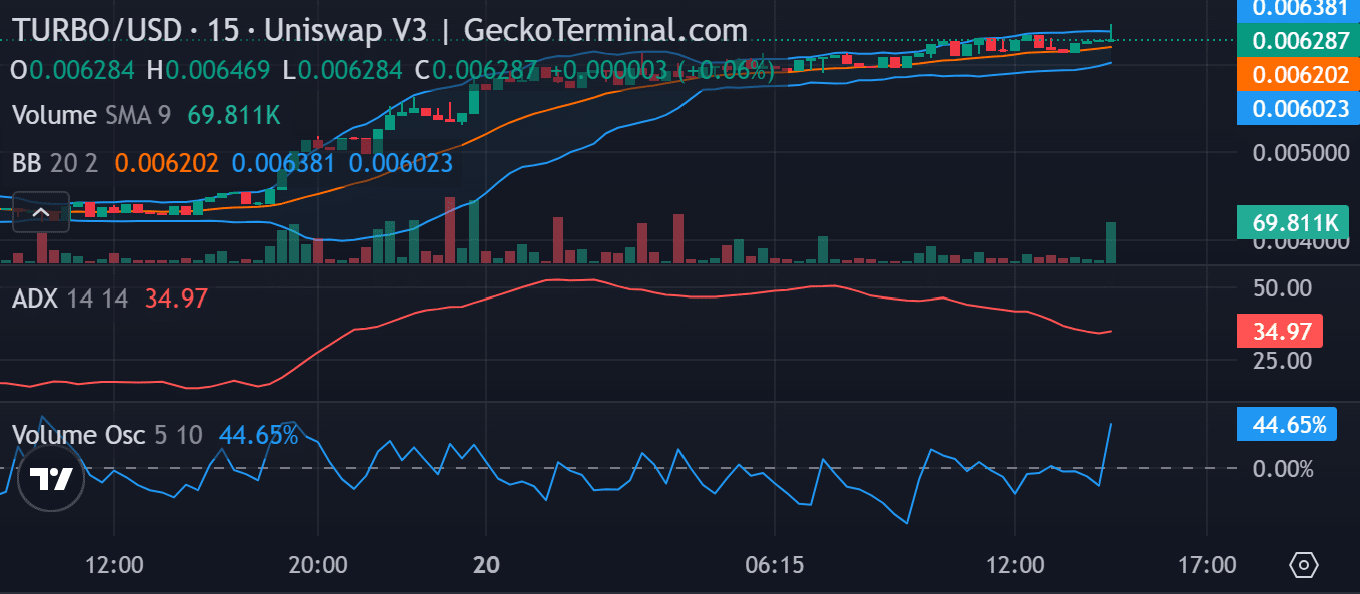
15-minute TURBO/USD Chart | Source: Gecko Terminal