Bitget App
Trade smarter
Buy cryptoMarketsTradeFuturesEarnWeb3SquareMore
Trade
Spot
Buy and sell crypto with ease
Margin
Amplify your capital and maximize fund efficiency
Onchain
Going Onchain, without going Onchain!
Convert & block trade
Convert crypto with one click and zero fees
Explore
Launchhub
Gain the edge early and start winning
Copy
Copy elite trader with one click
Bots
Simple, fast, and reliable AI trading bot
Trade
USDT-M Futures
Futures settled in USDT
USDC-M Futures
Futures settled in USDC
Coin-M Futures
Futures settled in cryptocurrencies
Explore
Futures guide
A beginner-to-advanced journey in futures trading
Futures promotions
Generous rewards await
Overview
A variety of products to grow your assets
Simple Earn
Deposit and withdraw anytime to earn flexible returns with zero risk
On-chain Earn
Earn profits daily without risking principal
Structured Earn
Robust financial innovation to navigate market swings
VIP and Wealth Management
Premium services for smart wealth management
Loans
Flexible borrowing with high fund security
Bitcoin Price Analysis: Here’s the Next Target for BTC Before Bulls Can Hope for $70K

Bitcoin Price Analysis: Here’s the Next Target for BTC Before Bulls Can Hope for $70K

CryptopotatoCryptopotato2024/07/21 07:47
By:Author: CryptoVizArt

Bitcoin’s recovery is going well, and the market is seemingly on the verge of creating a new all-time high in the short term.

Technical Analysis

By TradingRage
Bitcoin Price Analysis: Here’s the Next Target for BTC Before Bulls Can Hope for $70K image 0

The Daily Chart

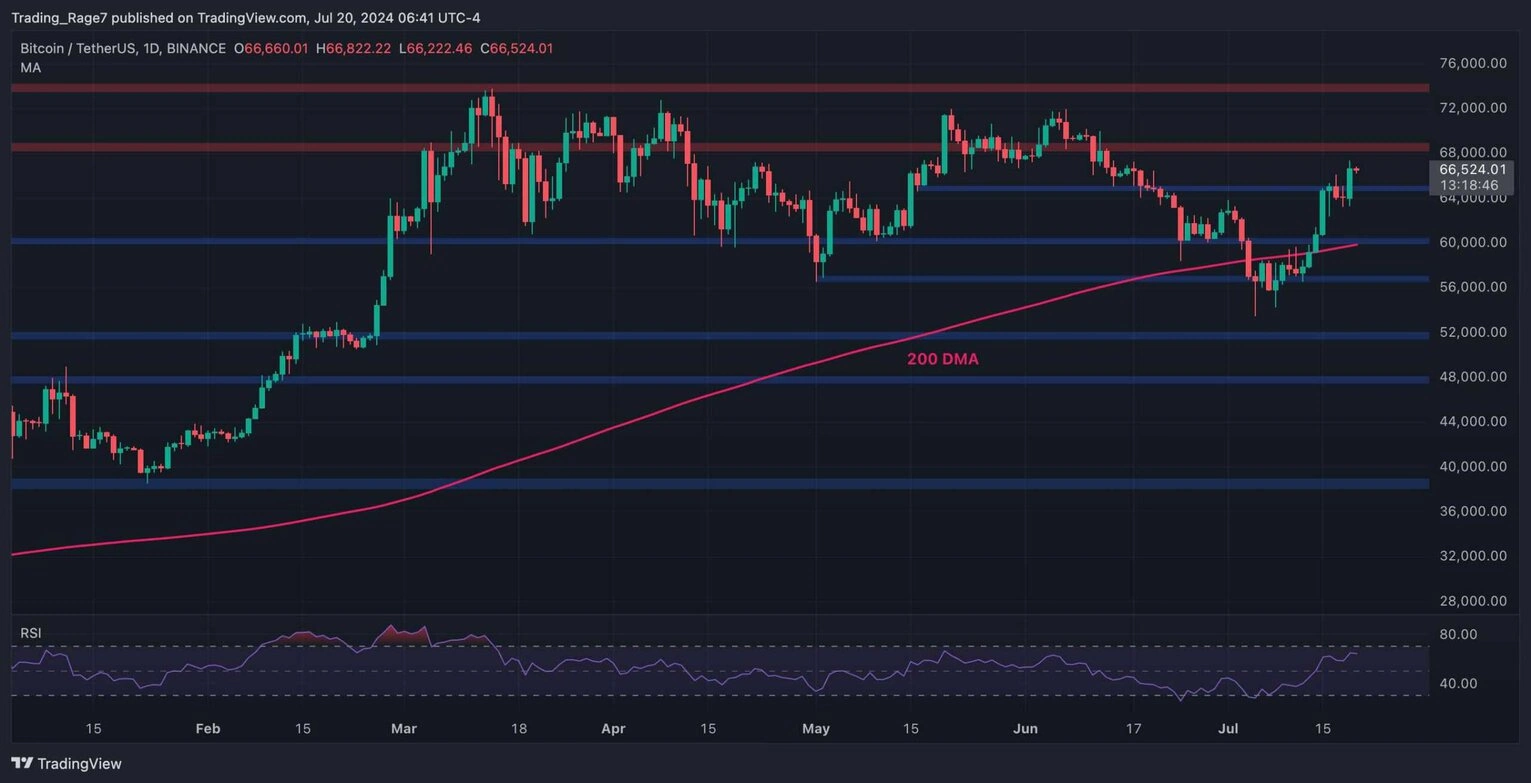
As the daily chart depicts, Bitcoin’s price has been rallying since it rose above the 200-day moving average.

The market has also reclaimed the $60K and $65K levels and is moving toward the $68K resistance zone, which could be the last obstacle before creating a new all-time high. With the RSI also indicating that the price has clear bullish momentum, it could only be a matter of time.

The 4-Hour Chart

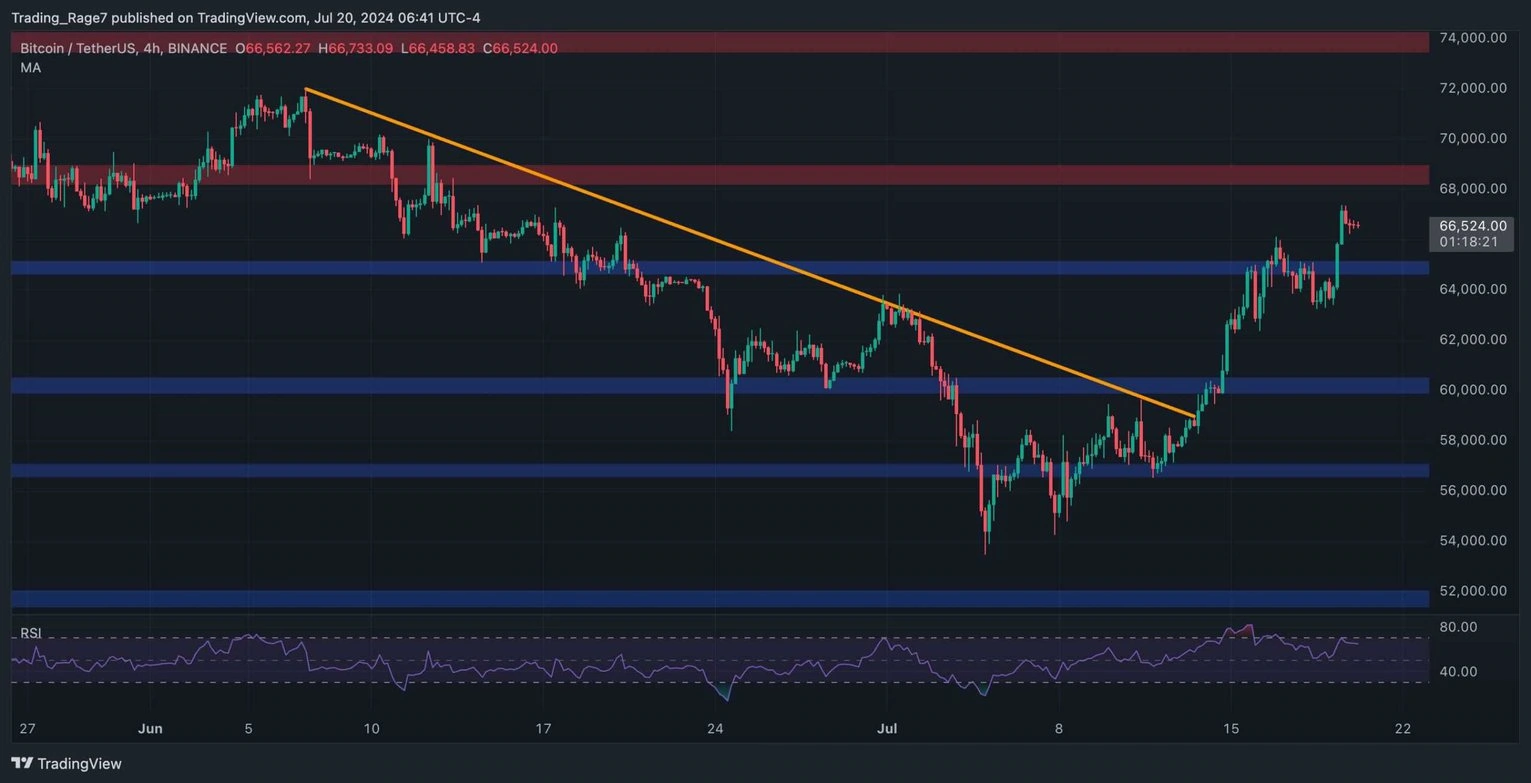
Looking at the 4-hour chart, it is evident that the price has been rising rapidly since breaking the bearish trendline to the upside. The market has also broken through the $65K resistance level with momentum, turning it into a support.

While almost everything points to a new record high in the coming weeks, there is one worrying signal. The RSI is showing a clear bearish divergence between the recent price highs, which could indicate a correction or even a reversal in the short term.
Bitcoin Price Analysis: Here’s the Next Target for BTC Before Bulls Can Hope for $70K image 1

2

Disclaimer: The content of this article solely reflects the author's opinion and does not represent the platform in any capacity. This article is not intended to serve as a reference for making investment decisions.

PoolX: Earn new token airdrops
Lock your assets and earn 10%+ APR
Lock now!